EEOC Releases Data Dashboard for 2017 & 2018 Pay Data Collection
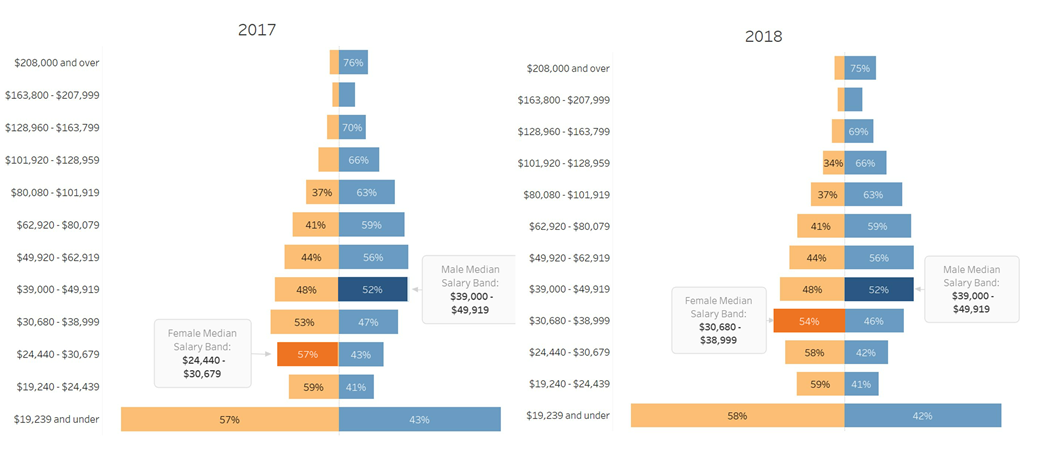
Visualization showing the national median pay band was higher for men than women in 2017 and 2018 pay data reported to the EEOC. +Enlarge this image.
WASHINGTON – Today the U.S. Equal Employment Opportunity Commission (EEOC) is making available a data dashboard featuring the historic, first-time collection of 2017 and 2018 pay data reported by about 70,000 private employers and certain federal contractors with 100 or more employees each year, representing over 100 million workers. The dashboard contains a unique collection of aggregated employer-level workforce demographic and pay data, reported by pay band. By aggregating this data, the EEOC is protecting the confidentiality of employees and employers.
The release of this dashboard allows industries, employers, and individuals to assess generally how their pay by sex and race compares to others in their industry, job category, or state. Overall, the data employers reported show in the aggregate that women are typically paid less than men.
“The dashboard illustrates what we have long known—that pay disparities based on sex and race persist in almost every industry both at the national level and in nearly every state. Women are paid less than men in the aggregate, and Black women and American Indian or Alaska Native women are paid the least. In addition, Black and Hispanic employees generally were in lower median pay bands than white employees in the same industries and job categories. Making this aggregated data available to the public shows how pay data collection can shine a light on the problem and potential solutions,” said EEOC Chair Charlotte A. Burrows. “The EEOC remains dedicated to using all of our tools to combat pay discrimination and to fulfill the promise of equal opportunity in our nation’s civil rights laws.”
Highlights from the data include:
- Overall: In 2018, the national median pay band for men was one pay band higher than the median pay band for women ($39,000 to $49,900 compared to $30,600 to $38,900), and in 2017, it was two pay bands higher ($39,000 to $49,900 compared to $24,400 to $30,600).
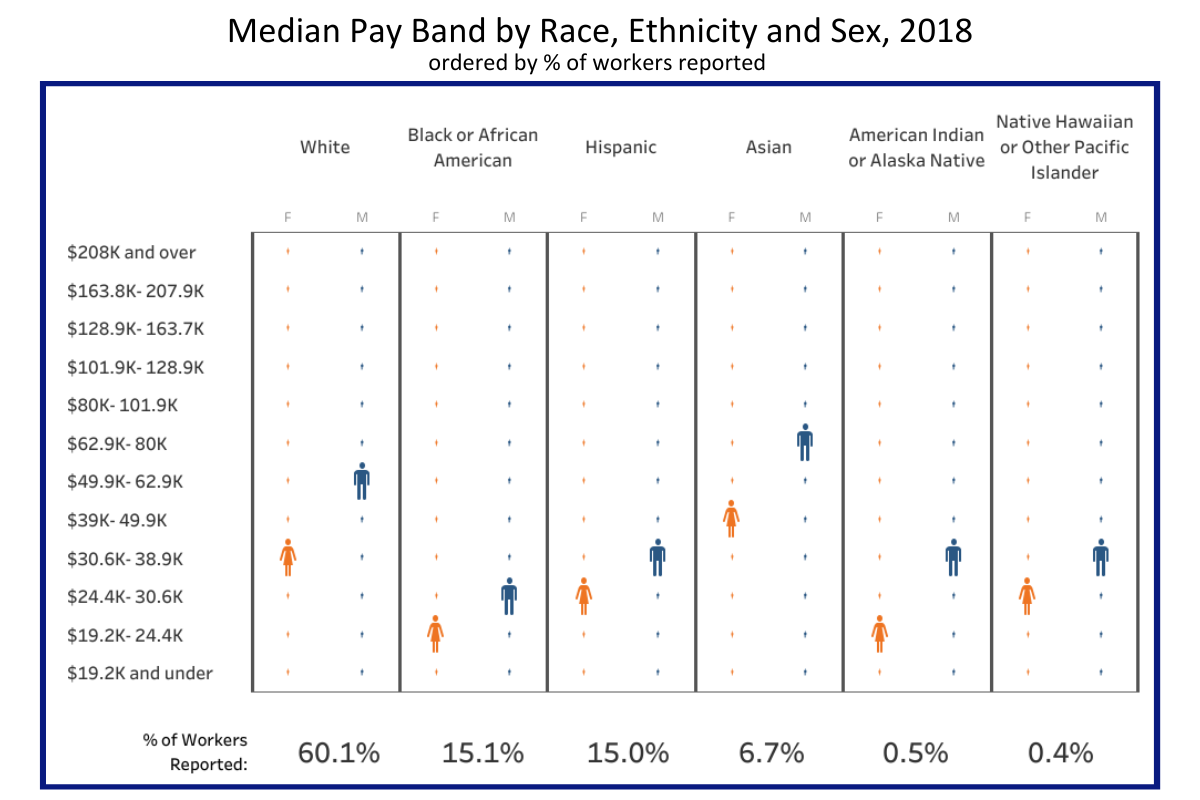
- Race and Ethnicity: In 2018, in each race and ethnicity category, women were in a lower median pay band than men of the same race or ethnicity, with Black or African American women and American Indian or Alaska Native women in the lowest median pay band of all groups ($19,200 to $24,400).
Chart showing median pay bands of women and men by race and ethnicity in 2018, categories ordered by percent of total workers reported. +Enlarge this image.
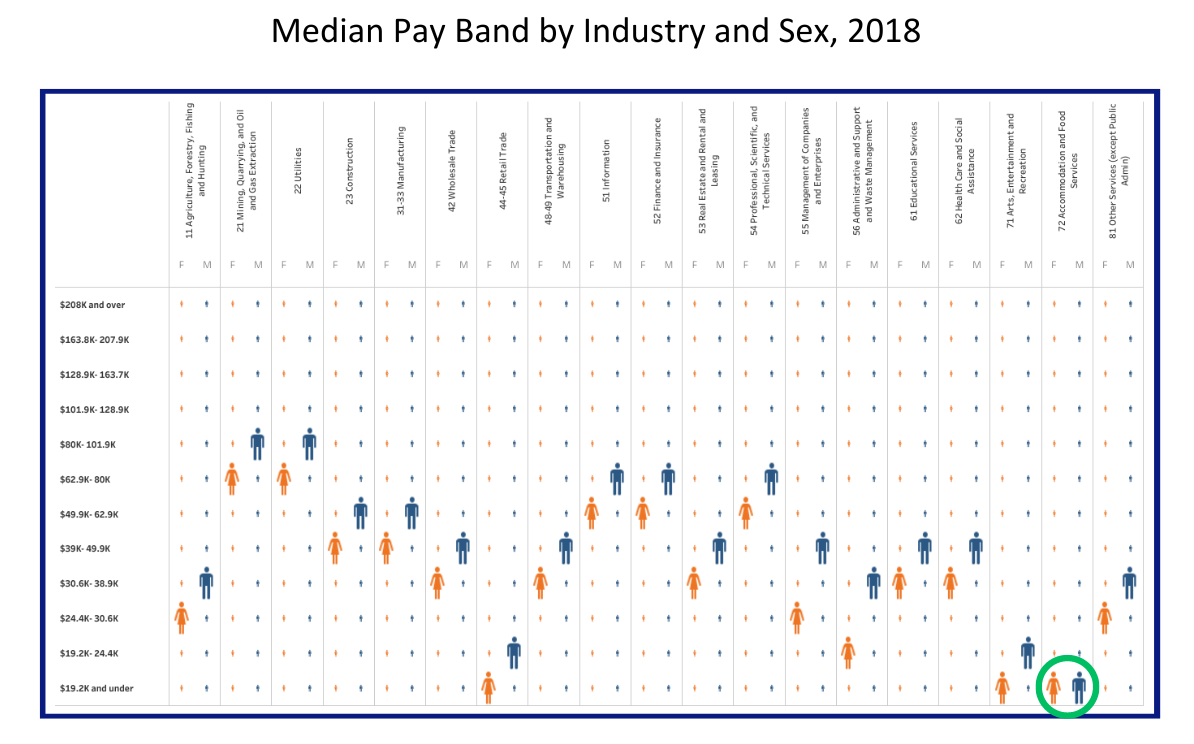
- Industries: In 2018, the median pay band for men was higher than the median pay band for women in all industries except that it was the same in Accommodation and Food Services. In that industry, both men and women were in the lowest median pay band ($19,200 and under). In 2017, men and women were in the same median pay band in only one other industry, Mining, Quarrying, and Oil and Gas extraction.
Chart showing median pay bands for women and men in 19 industries in 2018. One industry, Accommodation and Food Services, has women and men in the same band (the lowest band), which is circled. +Enlarge this image.
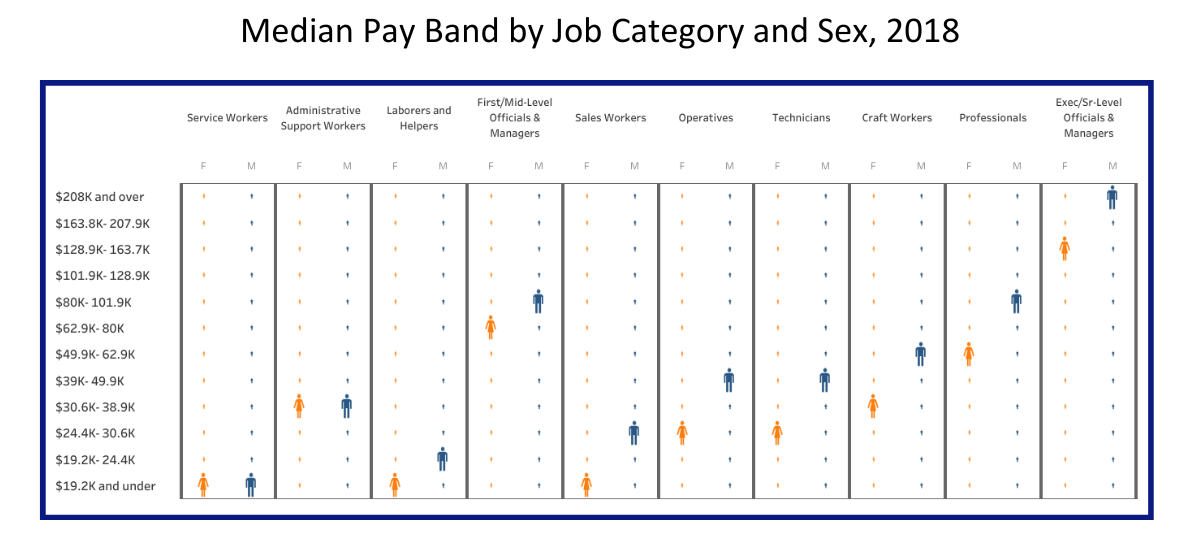
- Job Categories: In 2018, for all but 2 of the 10 job categories, the median pay band for men was higher than the median pay band for women, and for 6 of the job categories, the median pay band for men was two higher than the median pay band for women. Men and women in the job categories of Administrative Support Workers and Service Workers had the same median pay band.
Chart showing median pay bands for women and men in 10 job categories in 2018. The columns are ordered from job categories with the least difference in median pay band between men and women to the job categories with the greatest difference. +Enlarge this image.
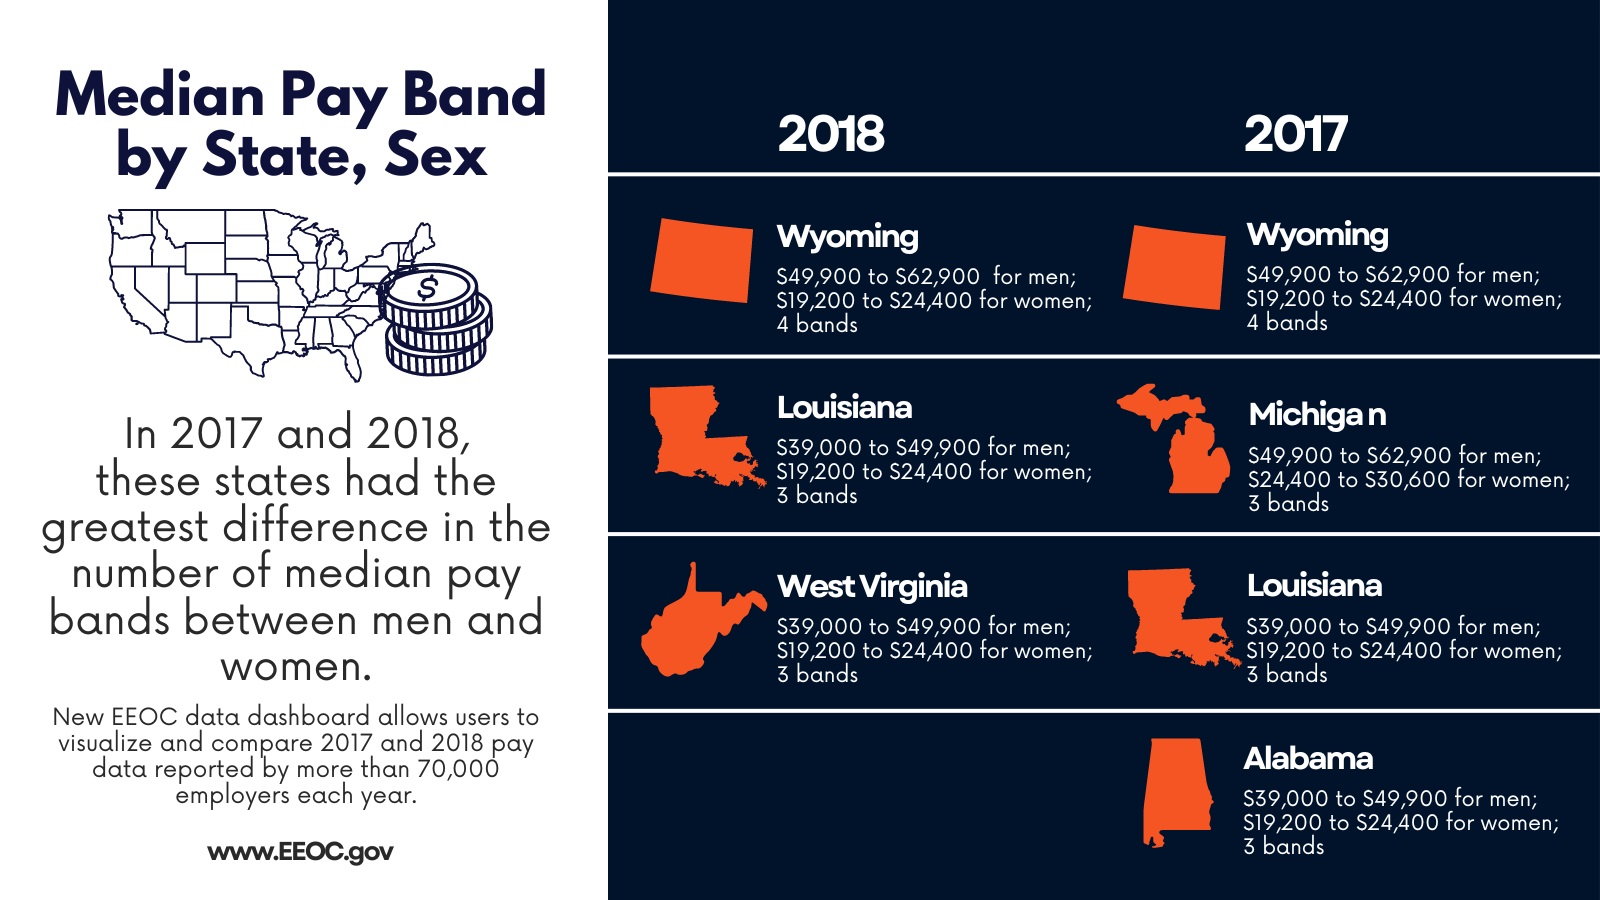
- Geography: Hawaii was the only state in which the median pay bands for men and women were the same in 2018 and 2017 ($30,600 to $38,900).
- In 2018, states with the greatest difference in the number of median pay bands between men and women:
- Wyoming ($49,900 to $62,900 for men; $19,200 to $24,400 for women; 4 bands)
- Louisiana ($39,000 to $49,900 for men; $19,200 to $24,400 for women; 3 bands)
- West Virginia ($39,000 to $49,900for men; $19,200 to $24,400 for women; 3 bands)
- In 2017:
- Wyoming ($49,900 to $62,900 for men; $19,200 to $24,400 for women; 4 bands)
- Michigan ($49,900 to $62,900 for men; $24,400 to $30,600 for women; 3 bands)
- Louisiana ($39,000 to $49,900 for men; $19,200 to $24,400 for women; 3 bands)
- Alabama ($39,000 to $49,900 for men; $19,200 to $24,400 for women; 3 bands)
Members of the public may download a public use file to further explore this data collection. Additional information on accessing the dashboard and how to use the tools is available in the EEOC’s User Guide and FAQs.
For more information about the EEO-1 Component 2 pay data collection, visit “What You Should Know: The National Academies’ Evaluation of Compensation Data Collected Through the EEO-1 Form” on the EEOC website. Pursuant to section 709(c) of Title VII, EEOC regulations require certain employers and other entities covered by Title VII to report workforce demographic information to the EEOC. Since 1966, the EEOC has collected workforce demographic information from certain private employers and federal contractors through the EEO-1 form (now known as “Component 1” of the EEO-1). In 2016, the EEOC added a pay data collection to the EEO-1, known as “Component 2.” The EEOC collected 2017 and 2018 pay data from private employers through the EEO-1 Component 2 between July 2019 and February 2020.
The EEOC enforces the Equal Pay Act of 1963 and Title VII of the Civil Rights Act of 1964 which together prohibit pay discrimination on the basis of sex, race, color, national origin, and religion.
The EEOC advances opportunity in the workplace by enforcing federal laws prohibiting employment discrimination. More information is available at www.eeoc.gov. Stay connected with the latest EEOC news by subscribing to our email updates.
###
Contact Victor Chen, Brandalyn Bickner, James Ryan, Kim Dulic
Office of Communications & Legislative Affairs
131 M Street NE
Washington, DC 20507
newsroom@eeoc.gov
ASL videophone 844-234-5122
Source: U.S. Equal Employment Opportunity Commission (EEOC.gov)


