

America’s Car-Mart Reports Third Quarter Fiscal Year 2025 Results
ROGERS, Ark., March 06, 2025 (GLOBE NEWSWIRE) -- America’s Car-Mart, Inc. (NASDAQ: CRMT) (“we,” “Car-Mart” or the “Company”), today reported financial results for the third quarter ended January 31, 2025.
Third Quarter Key Highlights (FY’25 Q3 vs. FY’24 Q3, unless otherwise noted)
| ||
President and CEO Doug Campbell commentary:
“We continue to strengthen our business by enhancing our financial flexibility, improving our operational and technology capabilities, and adding proven leaders to our team which allowed us to grow volumes, gross margin, and minimize losses during the quarter. Both our amended ABL facility and most recent ABS transaction have further advanced our capital position and provide a foundation for further development of a competitive funding structure going forward. Our LOS has transformed our underwriting with meaningfully improved credit performance, which gives us tremendous confidence in our ability to support both current and future customers. I would also like to thank our associates who are helping our customers navigate the current environment.”
| Third Quarter Fiscal Year 2025 Key Operating Metrics |
Dollars in thousands, except per share data. Dollar and percentage changes may not recalculate due to rounding. Charts may not be to scale.
| Third Quarter Business Review |
Note: Discussions in each section provide information for the third quarter of fiscal year 2025 compared to the third quarter of fiscal year 2024, unless otherwise noted.
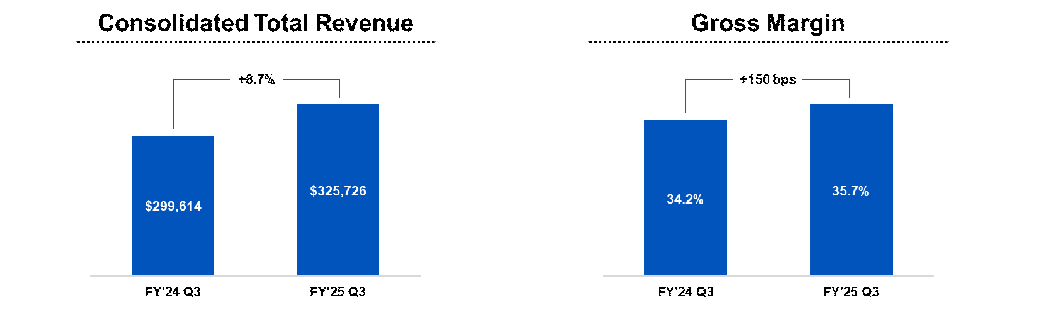
TOTAL REVENUE– An 8.7% increase in revenue was primarily driven by an increase in retail units sold, partially offset by a 0.9% decrease in the average retail sales price. Interest income contributed favorably and was up 5.1% year-over-year.
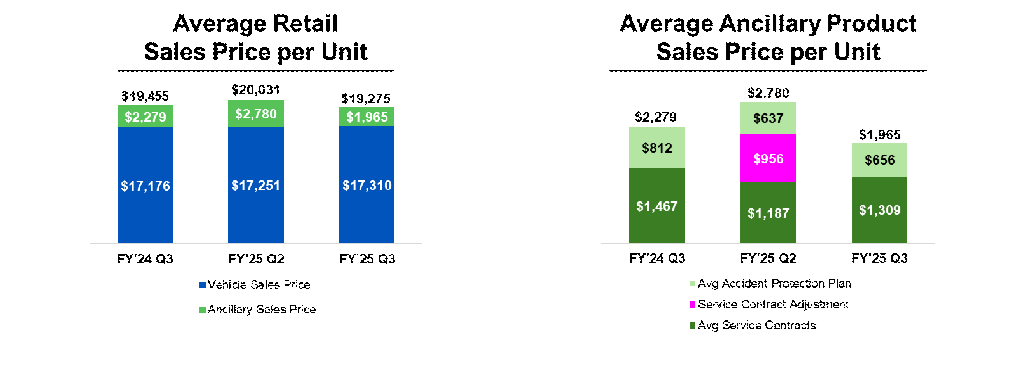
SALES– Sales volumes increased 13.2%, 13,198 units vs. 11,664 units. The prior fiscal year quarter volumes were negatively impacted by tighter underwriting standards associated with the implementation of the Company’s LOS. The average vehicle retail sales price, excluding ancillary products, increased to $17,310, reflecting a $134 increase compared to the prior year period and a $59 increase when viewed sequentially. Additionally, the Company ended the quarter with more inventory on hand to support positive seasonal trends associated with spring selling and tax refund season.
GROSS PROFIT – Gross profit margin as a percentage of sales was 35.7%. The 150-basis point improvement was primarily due to continued improvements in vehicle procurement and disposal. This benefit was partially offset by increased accident protection plan claims primarily related to recent weather events.
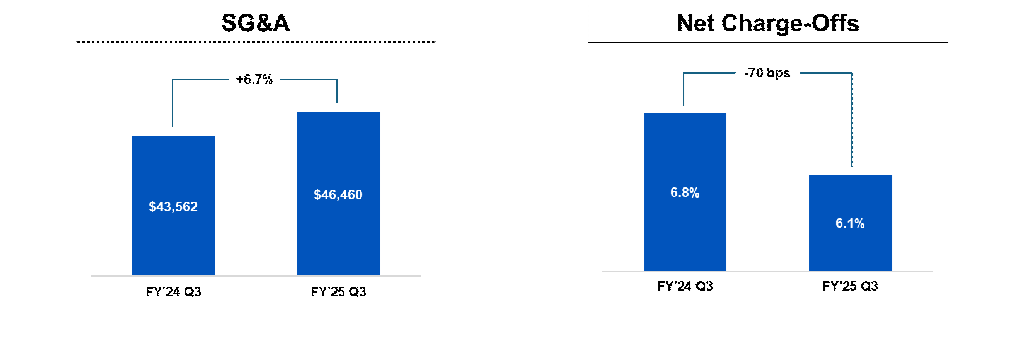
NET CHARGE-OFFS – Net charge-offs as a percentage of average finance receivables improved to 6.1% compared to 6.8%. On a relative basis, we saw improvements in both the frequency and severity of losses.
ALLOWANCE FOR CREDIT LOSSES– The allowance for credit losses as a percentage of finance receivables, net of deferred revenue and pending accident protection plan claims, improved to 24.31% at January 31, 2025, from 24.72% at October 31, 2024. The primary driver of this change was continued favorable performance in contracts originated under our LOS. As of January 31, 2025, approximately 58% of the outstanding portfolio balance (excluding acquisitions) was originated under the Company’s LOS also contributing to this favorable performance. Delinquencies (accounts over 30 days past due) increased by 40 basis points to 3.7% of finance receivables as of January 31, 2025, and were up 20 basis points sequentially. The slight increase in delinquencies was due to the impact recent weather events had on our customers, which has since improved.
UNDERWRITING– The average down payment, as a percentage of the average retail sales price, remained stable and was 5.1% for the quarter ended January 31, 2025. The average originating term was 44.6 months, up from 43.3 compared to the prior year quarter and up slightly from 44.2 sequentially. The Company continues to focus on improving deal structures, particularly within the underlying credit tiers of customers, which the Company expects to strengthen the performance of the portfolio going forward. Please see the table and supplemental material for Cash-on-Cash returns.
SG&A EXPENSE – SG&A expense was $46.5 million compared to $43.6 million. The Company’s last two acquisitions completed since the end of prior year quarter drove $1.8 million of the increase and the remainder was related to higher stock compensation. SG&A per average customer was $449 compared to $421. This 6.7% increase in SG&A per average customer was primarily due to recent acquisitions of dealerships that are currently building their customer bases.
LEVERAGE & LIQUIDITY –Debt to finance receivables and debt, net of cash, to finance receivables (non-GAAP)1 were 53.5% and 45.0%, compared to 51.8% and 45.2%, respectively, at January 31, 2024. During the nine months ended January 31, 2025, the Company grew finance receivables by $50.6 million, increased inventory by $36.5 million, and invested in acquisition and fixed assets of $10.6 million, with a $9.0 million increase in debt, net of cash.
FINANCINGS – On January 31, 2025, the Company completed a term securitization transaction involving the issuance of $200 million in principal amount of asset-backed notes with an overall weighted average life adjusted coupon of 6.49%. The weighted average life adjusted coupon improved 95 basis points from prior October 2024 securitization, and the transaction was oversubscribed by more than 10 times the principal amount sold.
Additionally, as previously reported, following the completion of the third quarter, on February 28, 2025, the Company entered into an amendment to its existing asset-based lending revolving credit facility (“ABL Facility”) that expanded the total available borrowings under the facility to $350 million and extended the maturity date to March 2027. There was approximately $75 million drawn on the ABL Facility as of January 31, 2025.
ANNUAL CASH-ON-CASH RETURNS– The Company continues to generate solid cash-on-cash returns.
The following table sets forth the actual and projected cash-on-cash returns as of January 31, 2025, for the Company’s finance receivables by origination year. The return percentages provided for contracts originated in fiscal years 2017 through 2020 reflect the Company’s actual cash-on-cash returns.
| Cash on Cash Return | |||||
| Loan Origination Year | % of A/R Remaining | Current Projected/Actual | Prior Projected | Variance | |
| FY2017 | 0.0% | 61.1% | * | * | |
| FY2018 | 0.0% | 67.6% | * | * | |
| FY2019 | 0.0% | 70.0% | * | * | |
| FY2020 | 0.1% | 73.6% | * | * | |
| FY2021 | 1.0% | 71.7% | 72.4% | -0.7% | |
| FY2022 | 6.7% | 52.2% | 53.8% | -1.6% | |
| FY2023 | 19.3% | 44.9% | 47.1% | -2.2% | |
| FY2024 | 44.7% | 60.3% | 62.9% | -2.6% | |
| FY2025 | 83.7% | 74.4% | 72.3% | 2.1% | |
| * 2017 -2020 Pools ' Current Projection reflects actual cash on cash return | |||||
1 Calculation of this non-GAAP financial measure and a reconciliation to the most directly comparable GAAP measure are included in the tables accompanying this release
2 “Cash-on-cash returns” represent the return on cash invested by the Company in the vehicle finance loans the Company originates and is calculated with respect to a pool of loans (or finance receivables) by dividing total “cash in” less “cash out” by total “cash out” with respect to such pool. “Cash in” represents the total cash the Company expects to collect on the pool of finance receivables, including credit losses. This includes down-payments, principal and interest collected (including special and seasonal payments) and the fair market value of repossessed vehicles, if applicable. “Cash out” includes purchase price paid by the Company to acquire the vehicle (including reconditioning and transportation costs), and all other post-sale expenses as well as expenses related to our ancillary products. The calculation assumes estimates on expected credit losses net of fair market value of repossessed vehicles and the related timing of such losses as well as post sales repair expenses and special payments. The Company evaluates and updates expected credit losses quarterly. The credit quality of each pool is monitored and compared to prior and initial forecasts and is reflected in our on-going internal cash-on-cash projections.
| Key Operating Results |
| Three Months Ended | ||||||||||||
| January 31, | ||||||||||||
| 2025 | 2024 | % Change | ||||||||||
| Operating Data: | ||||||||||||
| Retail units sold | 13,198 | 11,664 | 13.2 | % | ||||||||
| Average number of stores in operation | 154 | 154 | - | |||||||||
| Average retail units sold per store per month | 28.6 | 25.2 | 13.5 | |||||||||
| Average retail sales price | $ | 19,275 | $ | 19,455 | (0.9 | ) | ||||||
| Total gross profit per retail unit sold | $ | 7,131 | $ | 7,043 | 1.2 | |||||||
| Total gross profit percentage | 35.7 | % | 34.2 | % | ||||||||
| Same store revenue growth | 3.1 | % | (9.3 | )% | ||||||||
| Net charge-offs as a percent of average finance receivables | 6.1 | % | 6.8 | % | ||||||||
| Total collected (principal, interest and late fees), in thousands | $ | 176,338 | $ | 167,664 | 5.2 | |||||||
| Average total collected per active customer per month | $ | 568 | $ | 540 | 5.2 | |||||||
| Average percentage of finance receivables-current (excl. 1-2 day) | 81.3 | % | 80.4 | % | ||||||||
| Average down-payment percentage | 5.1 | % | 5.1 | % | ||||||||
| Nine Months Ended | ||||||||||||
| January 31, | ||||||||||||
| 2025 | 2024 | % Change | ||||||||||
| Operating Data: | ||||||||||||
| Retail units sold | 41,373 | 42,738 | (3.2 | ) | % | |||||||
| Average number of stores in operation | 155 | 154 | 0.6 | |||||||||
| Average retail units sold per store per month | 29.7 | 30.8 | (3.6 | ) | ||||||||
| Average retail sales price | $ | 19,531 | $ | 19,062 | 2.5 | |||||||
| Total gross profit per retail unit sold | $ | 7,429 | $ | 6,867 | 8.2 | |||||||
| Total gross profit percentage | 36.7 | % | 34.4 | % | ||||||||
| Same store revenue growth | (5.2 | )% | 1.0 | % | ||||||||
| Net charge-offs as a percent of average finance receivables | 19.1 | % | 20.0 | % | ||||||||
| Total collected (principal, interest and late fees), in thousands | $ | 522,988 | $ | 501,692 | 4.2 | |||||||
| Average total collected per active customer per month | $ | 563 | $ | 536 | 5.1 | |||||||
| Average percentage of finance receivables-current (excl. 1-2 day) | 81.3 | % | 80.4 | % | ||||||||
| Average down-payment percentage | 5.2 | % | 5.0 | % | ||||||||
| Period End Data: | ||||||||||||
| Stores open | 154 | 154 | - | % | ||||||||
| Accounts over 30 days past due | 3.7 | % | 3.3 | % | ||||||||
| Active customer count | 103,663 | 102,175 | 1.5 | |||||||||
| Principal balance of finance receivables (in thousands) | $ | 1,485,981 | $ | 1,428,908 | 4.0 | |||||||
| Weighted average total contract term | 48.3 | 47.6 | 1.5 | |||||||||
| Conference Call and Webcast |
The Company will hold a conference call to discuss its quarterly results on Thursday, March 6, at 9:00 am ET. Participants may access the conference call via webcast using this link: Webcast Link. To participate via telephone, please register in advance using this Registration Link. Upon registration, all telephone participants will receive a one-time confirmation email detailing how to join the conference call, including the dial-in number along with a unique PIN that can be used to access the call. All participants are encouraged to dial in 10 minutes prior to the start time. A replay and transcript of the conference call and webcast will be available on-demand for 12 months.
| About America’s Car-Mart, Inc. |
America’s Car-Mart, Inc. (the “Company”) operates automotive dealerships in 12 states and is one of the largest publicly held automotive retailers in the United States focused exclusively on the “Integrated Auto Sales and Finance” segment of the used car market. The Company emphasizes superior customer service and the building of strong personal relationships with its customers. The Company operates its dealerships primarily in smaller cities throughout the South-Central United States, selling quality used vehicles and providing financing for substantially all of its customers. For more information about America’s Car-Mart, including investor presentations, please visit our website at www.car-mart.com.
| Non-GAAP Financial Measures |
This news release contains financial information determined by methods other than in accordance with generally accepted accounting principles (GAAP). We present total debt, net of total cash, to finance receivables, a non-GAAP measure, as a supplemental measure of our performance. We believe total debt, net of total cash, to finance receivables is a useful measure to monitor leverage and evaluate balance sheet risk. This measure should not be considered in isolation or as a substitute for reported GAAP results because it may include or exclude certain items as compared to similar GAAP-based measures, and such measures may not be comparable to similarly-titled measures reported by other companies. We strongly encourage investors to review our consolidated financial statements included in publicly filed reports in their entirety and not rely solely on any one, single financial measure or communication. The most directly comparable GAAP financial measure, as well as a reconciliation to the comparable GAAP financial measure, for non-GAAP financial measures are presented in the tables of this release.
| Forward-Looking Statements |
This news release contains “forward-looking statements” within the meaning of the Private Securities Litigation Reform Act of 1995. These forward-looking statements address the Company’s future objectives, plans and goals, as well as the Company’s intent, beliefs and current expectations and projections regarding future operating performance and can generally be identified by words such as “may,” “will,” “should,” “could,” “expect,” “anticipate,” “intend,” “plan,” “project,” “foresee,” and other similar words or phrases. Specific events addressed by these forward-looking statements may include, but are not limited to:
- operational infrastructure investments;
- same dealership sales and revenue growth;
- customer growth and engagement;
- gross profit percentages;
- gross profit per retail unit sold;
- business acquisitions;
- inventory acquisition, reconditioning, transportation, and remarketing;
- technological investments and initiatives;
- future revenue growth;
- receivables growth as related to revenue growth;
- new dealership openings;
- performance of new dealerships;
- interest rates;
- future credit losses;
- the Company’s collection results, including but not limited to collections during income tax refund periods;
- cash-on-cash returns from the collection of contracts originated by the Company
- seasonality; and
- the Company’s business, operating and growth strategies and expectations.
These forward-looking statements are based on the Company’s current estimates and assumptions and involve various risks and uncertainties. As a result, you are cautioned that these forward-looking statements are not guarantees of future performance, and that actual results could differ materially from those projected in these forward-looking statements. Factors that may cause actual results to differ materially from the Company’s projections include, but are not limited to:
- general economic conditions in the markets in which the Company operates, including but not limited to fluctuations in gas prices, grocery prices and employment levels and inflationary pressure on operating costs;
- the availability of quality used vehicles at prices that will be affordable to our customers, including the impacts of changes in new vehicle production and sales;
- the ability to leverage the Cox Automotive services agreement to perform reconditioning and improve vehicle quality to reduce the average vehicle cost, improve gross margins, reduce credit loss, and enhance cash flow;
- the availability of credit facilities and access to capital through securitization financings or other sources on terms acceptable to us, and any increase in the cost of capital, to support the Company’s business;
- the Company’s ability to underwrite and collect its contracts effectively, including whether anticipated benefits from the Company’s recently implemented loan origination system are achieved as expected or at all;
- competition;
- dependence on existing management;
- ability to attract, develop, and retain qualified general managers;
- changes in consumer finance laws or regulations, including but not limited to rules and regulations that have recently been enacted or could be enacted by federal and state governments;
- the ability to keep pace with technological advances and changes in consumer behavior affecting our business;
- security breaches, cyber-attacks, or fraudulent activity;
- the ability to identify and obtain favorable locations for new or relocated dealerships at reasonable cost;
- the ability to successfully identify, complete and integrate new acquisitions;
- the occurrence and impact of any adverse weather events or other natural disasters affecting the Company’s dealerships or customers; and
- potential business and economic disruptions and uncertainty that may result from any future public health crises and any efforts to mitigate the financial impact and health risks associated with such developments.
Additionally, risks and uncertainties that may affect future results include those described from time to time in the Company’s SEC filings. The Company undertakes no obligation to update or revise any forward-looking statements, whether as a result of new information, future events or otherwise. Readers are cautioned not to place undue reliance on these forward-looking statements, which speak only as of the dates on which they are made.
| Contact for information |
Vickie Judy, CFO
479-464-9944
Investor_relations@car-mart.com
SM Berger & Company
Andrew Berger, Managing Director
andrew@smberger.com
(216) 464-6400
| America’s Car-Mart Consolidated Results of Operations | |||||||||||||||||||||||
| (Amounts in thousands, except per share data) | |||||||||||||||||||||||
| As a % of Sales | |||||||||||||||||||||||
| Three Months Ended | Three Months Ended | ||||||||||||||||||||||
| January 31, | January 31, | ||||||||||||||||||||||
| 2025 | 2024 | % Change | 2025 | 2024 | |||||||||||||||||||
| Statements of Operations: | |||||||||||||||||||||||
| Revenues: | |||||||||||||||||||||||
| Sales | $ | 263,484 | $ | 240,401 | 9.6 | % | 100.0 | % | 100.0 | % | |||||||||||||
| Interest income | 62,242 | 59,213 | 5.1 | 23.6 | 24.6 | ||||||||||||||||||
| Total | 325,726 | 299,614 | 8.7 | 123.6 | 124.6 | ||||||||||||||||||
| . | |||||||||||||||||||||||
| Costs and expenses: | |||||||||||||||||||||||
| Cost of sales | 169,374 | 158,250 | 7.0 | 64.3 | 65.8 | ||||||||||||||||||
| Selling, general and administrative | 46,460 | 43,562 | 6.7 | 17.6 | 18.1 | ||||||||||||||||||
| Provision for credit losses | 86,652 | 89,582 | (3.3 | ) | 32.9 | 37.3 | |||||||||||||||||
| Interest expense | 16,923 | 16,731 | 1.1 | 6.4 | 7.0 | ||||||||||||||||||
| Depreciation and amortization | 1,890 | 1,712 | 10.4 | 0.7 | 0.7 | ||||||||||||||||||
| Loss on disposal of property and equipment | 37 | 119 | (68.9 | ) | - | - | |||||||||||||||||
| Total | 321,336 | 309,956 | 3.7 | 121.9 | 128.9 | ||||||||||||||||||
| Income (loss) before taxes | 4,390 | (10,342 | ) | 1.7 | (4.3 | ) | |||||||||||||||||
| Provision (benefit) for income taxes | 1,228 | (1,800 | ) | 0.5 | (0.7 | ) | |||||||||||||||||
| Net income (loss) | $ | 3,162 | $ | (8,542 | ) | 1.2 | (3.6 | ) | |||||||||||||||
| Dividends on subsidiary preferred stock | $ | (10 | ) | $ | (10 | ) | |||||||||||||||||
| Net income (loss) attributable to common shareholders | $ | 3,152 | $ | (8,552 | ) | ||||||||||||||||||
| Earnings per share: | |||||||||||||||||||||||
| Basic | $ | 0.38 | $ | (1.34 | ) | ||||||||||||||||||
| Diluted | $ | 0.37 | $ | (1.34 | ) | ||||||||||||||||||
| Weighted average number of shares used in calculation: | |||||||||||||||||||||||
| Basic | 8,256,681 | 6,393,080 | |||||||||||||||||||||
| Diluted | 8,413,088 | 6,393,080 | |||||||||||||||||||||
| America’s Car-Mart Consolidated Results of Operations | |||||||||||||||||||||||
| (Amounts in thousands, except per share data) | |||||||||||||||||||||||
| As a % of Sales | |||||||||||||||||||||||
| Nine Months Ended | Nine Months Ended | ||||||||||||||||||||||
| January 31, | January 31, | ||||||||||||||||||||||
| 2025 | 2024 | % Change | 2025 | 2024 | |||||||||||||||||||
| Statements of Operations: | |||||||||||||||||||||||
| Revenues: | |||||||||||||||||||||||
| Sales | $ | 836,506 | $ | 854,170 | (2.1 | ) | % | 100.0 | % | 100.0 | % | ||||||||||||
| Interest income | 184,252 | 175,051 | 5.3 | 22.0 | 20.5 | ||||||||||||||||||
| Total | 1,020,758 | 1,029,221 | (0.8 | ) | 122.0 | 120.5 | |||||||||||||||||
| Costs and expenses: | |||||||||||||||||||||||
| Cost of sales | 529,159 | 560,692 | (5.6 | ) | 63.3 | 65.6 | |||||||||||||||||
| Selling, general and administrative | 140,578 | 134,895 | 4.2 | 16.8 | 15.8 | ||||||||||||||||||
| Provision for credit losses | 281,597 | 321,300 | (12.4 | ) | 33.7 | 37.6 | |||||||||||||||||
| Interest expense | 53,277 | 47,587 | 12.0 | 6.4 | 5.6 | ||||||||||||||||||
| Depreciation and amortization | 5,700 | 5,101 | 11.7 | 0.6 | 0.6 | ||||||||||||||||||
| Loss on disposal of property and equipment | 124 | 359 | (65.5 | ) | - | - | |||||||||||||||||
| Total | 1,010,435 | 1,069,934 | (5.6 | ) | 120.8 | 125.2 | |||||||||||||||||
| Income (loss) before taxes | 10,323 | (40,713 | ) | 1.2 | (4.7 | ) | |||||||||||||||||
| Provision (benefit) for income taxes | 3,026 | (8,894 | ) | 0.4 | (1.0 | ) | |||||||||||||||||
| Net income (loss) | $ | 7,297 | $ | (31,819 | ) | 0.8 | (3.7 | ) | |||||||||||||||
| Dividends on subsidiary preferred stock | $ | (30 | ) | $ | (30 | ) | |||||||||||||||||
| Net income (loss) attributable to common shareholders | $ | 7,267 | $ | (31,849 | ) | ||||||||||||||||||
| Earnings per share: | |||||||||||||||||||||||
| Basic | $ | 0.96 | $ | (4.99 | ) | ||||||||||||||||||
| Diluted | $ | 0.94 | $ | (4.99 | ) | ||||||||||||||||||
| Weighted average number of shares used in calculation: | |||||||||||||||||||||||
| Basic | 7,600,470 | 6,386,997 | |||||||||||||||||||||
| Diluted | 7,753,654 | 6,386,997 | |||||||||||||||||||||
| America 's Car-Mart, Inc. | |||||||||||||
| Condensed Consolidated Balance Sheet and Other Data | |||||||||||||
| (Amounts in thousands, except per share data) | |||||||||||||
| January 31, | April 30, | January 31, | |||||||||||
| 2025 | 2024 | 2024 | |||||||||||
| Cash and cash equivalents | $ | 8,532 | $ | 5,522 | $ | 4,239 | |||||||
| Restricted cash from collections on auto finance receivables | $ | 117,826 | $ | 88,925 | $ | 90,350 | |||||||
| Finance receivables, net | $ | 1,146,212 | $ | 1,098,591 | $ | 1,085,772 | |||||||
| Inventory | $ | 143,933 | $ | 107,470 | $ | 109,313 | |||||||
| Total assets | $ | 1,607,099 | $ | 1,477,644 | $ | 1,466,947 | |||||||
| Revolving lines of credit, net | $ | 73,119 | $ | 200,819 | $ | 55,374 | |||||||
| Notes payable, net | $ | 722,245 | $ | 553,629 | $ | 684,688 | |||||||
| Treasury stock | $ | 298,218 | $ | 297,786 | $ | 297,757 | |||||||
| Total equity | $ | 557,911 | $ | 470,750 | $ | 469,007 | |||||||
| Shares outstanding | 8,256,765 | 6,394,675 | 6,391,061 | ||||||||||
| Book value per outstanding share | $ | 67.62 | $ | 73.68 | $ | 73.45 | |||||||
| Allowance as % of principal balance net of deferred revenue | 24.31 | % | 25.32 | % | 25.74 | % | |||||||
| Changes in allowance for credit losses: | |||||||||||||
| Nine months ended | |||||||||||||
| January 31, | |||||||||||||
| 2025 | 2024 | ||||||||||||
| Balance at beginning of period | $ | 331,260 | $ | 299,608 | |||||||||
| Provision for credit losses | 281,597 | 321,300 | |||||||||||
| Charge-offs, net of collateral recovered | (279,519 | ) | (285,921 | ) | |||||||||
| Balance at end of period | $ | 333,338 | $ | 334,987 | |||||||||
| America 's Car-Mart, Inc. | |||||||||
| Condensed Consolidated Statements of Cash Flows | |||||||||
| (Amounts in thousands) | |||||||||
| Nine Months Ended | |||||||||
| January 31, | |||||||||
| 2025 | 2024 | ||||||||
| Operating activities: | |||||||||
| Net income (loss) | $ | 7,297 | $ | (31,819 | ) | ||||
| Provision for credit losses | 281,597 | 321,300 | |||||||
| Losses on claims for accident protection plan | 25,013 | 24,480 | |||||||
| Depreciation and amortization | 5,700 | 5,101 | |||||||
| Finance receivable originations | (779,013 | ) | (794,477 | ) | |||||
| Finance receivable collections | 338,736 | 324,703 | |||||||
| Inventory | 53,330 | 103,451 | |||||||
| Deferred accident protection plan revenue | (1,462 | ) | (1,926 | ) | |||||
| Deferred service contract revenue | (11,818 | ) | (130 | ) | |||||
| Income taxes, net | (4,862 | ) | (10,735 | ) | |||||
| Other | 17,500 | (3,120 | ) | ||||||
| Net cash used in operating activities | (67,982 | ) | (63,172 | ) | |||||
| Investing activities: | |||||||||
| Purchase of investments | (7,527 | ) | (4,815 | ) | |||||
| Purchase of property and equipment and other | (3,065 | ) | (4,514 | ) | |||||
| Net cash used in investing activities | (10,592 | ) | (9,329 | ) | |||||
| Financing activities: | |||||||||
| Change in revolving credit facility, net | (126,752 | ) | (112,522 | ) | |||||
| Payments on notes payable | (479,326 | ) | (394,450 | ) | |||||
| Change in cash overdrafts | 58 | 2,183 | |||||||
| Issuances of notes payable | 649,889 | 610,340 | |||||||
| Debt issuance costs | (6,963 | ) | (5,892 | ) | |||||
| Purchase of common stock | (432 | ) | (336 | ) | |||||
| Dividend payments | (30 | ) | (30 | ) | |||||
| Exercise of stock options and issuance of common stock | 74,041 | (237 | ) | ||||||
| Net cash provided by financing activities | 110,485 | 99,056 | |||||||
| Increase in cash, cash equivalents, and restricted cash | $ | 31,911 | $ | 26,555 | |||||
| America 's Car-Mart, Inc. | |||||||||||||
| Reconciliation of Non-GAAP Financial Measures | |||||||||||||
| (Amounts in thousands) | |||||||||||||
| Calculation of Debt, Net of Total Cash, to Finance Receivables: | |||||||||||||
| January 31, 2025 | April 30, 2024 | January 31, 2024 | |||||||||||
| Debt: | |||||||||||||
| Revolving lines of credit, net | $ | 73,119 | $ | 200,819 | $ | 55,374 | |||||||
| Notes payable, net | 722,245 | 553,629 | 684,688 | ||||||||||
| Total debt | $ | 795,364 | $ | 754,448 | $ | 740,062 | |||||||
| Cash: | |||||||||||||
| Cash and cash equivalents | $ | 8,532 | $ | 5,522 | $ | 4,239 | |||||||
| Restricted cash from collections on auto finance receivables | 117,826 | 88,925 | 90,350 | ||||||||||
| Total cash, cash equivalents, and restricted cash | $ | 126,358 | $ | 94,447 | $ | 94,589 | |||||||
| Debt, net of total cash | $ | 669,006 | $ | 660,001 | $ | 645,473 | |||||||
| Principal balance of finance receivables | $ | 1,485,981 | $ | 1,435,388 | $ | 1,428,908 | |||||||
| Ratio of debt to finance receivables | 53.5 | % | 52.6 | % | 51.8 | % | |||||||
| Ratio of debt, net of total cash, to finance receivables | 45.0 | % | 46.0 | % | 45.2 | % | |||||||
Photos accompanying this announcement are available at
https://www.globenewswire.com/NewsRoom/AttachmentNg/0298ffd4-b76d-415a-a10f-c81091532782
https://www.globenewswire.com/NewsRoom/AttachmentNg/d1b76ebe-38ad-4c64-810f-be78437460cd
https://www.globenewswire.com/NewsRoom/AttachmentNg/11909d0f-ecc9-4929-b187-5238ed04ce0b

© 2025 GlobeNewswire, Inc. All Rights Reserved.


