

LexinFintech Holdings Ltd. Reports Fourth Quarter and Full Year 2024 Unaudited Financial Results
SHENZHEN, China, March 18, 2025 (GLOBE NEWSWIRE) -- LexinFintech Holdings Ltd. (“Lexin” or the “Company”) (NASDAQ: LX), a leading technology-empowered personal financial service enabler in China, today announced its unaudited financial results for the quarter ended December 31, 2024.
Mr. Jay Wenjie Xiao, Chairman and Chief Executive Officer of Lexin, commented, “The company remains committed to its prudent operating strategy and has achieved solid progress in its transformation, with key performance indicators showing continuous improvement.
For the fourth quarter, net income was RMB363 million, representing an increase of about 17% quarter-over-quarter, marking the fourth consecutive quarter of improved profitability. Total loan origination reached RMB52 billion, representing approximately a 2% quarter-over-quarter increase, and outstanding loan balance stood at RMB110 billion, all in line with our guidance.
As we advanced our risk management upgrading, we were pleased to see a continuous improvement in asset quality, evidenced by the decline in risk indicators of both newly originated and overall assets. This consistent enhancement in asset quality, along with ongoing operational refinements, has contributed to our sustainable profit growth.
Looking ahead to 2025, in light of the current macroeconomic and industry landscape, we will adhere to our prudent operating strategy, prioritizing asset quality and focusing on profitability enhancement. With this approach, we expect to sustain steady growth in our performance.
In accordance with our semi-annual dividend policy, the board of directors has approved a dividend of US$0.11 per ADS, representing 20% of net income from the second half of 2024. Effective from January 1, 2025, our cash dividend payout ratio will be raised to 25% of net income.”
Mr. James Zheng, Chief Financial Officer of Lexin, commented, “Building upon the solid foundation of the third quarter, we recorded a net income of RMB363 million in the fourth quarter, representing a 17% increase compared to last quarter and 54% increase compared to the net income adjusted for the investment losses in the same period last year, further extending our stable growth trajectory. The net income take rate, calculated as net income divided by the average loan balance, increased from 1.09% in the third quarter to 1.31% in the fourth quarter of 2024, advancing by 22 basis points.”
“Driven by the ongoing optimization of asset quality, further reduction in funding costs, a more balanced revenue mix, and improvement in customer acquisition efficiency, our revenue take rate and net income have continued to improve.”
“Having achieved substantial progress in our transformation, we will continue to execute our prudent operating strategy. Looking ahead, we expect flat to single-digit growth of total loan origination in 2025 in view of the macroeconomic conditions, alongside a significant year-over-year increase in net income driven by margin expansion.”
Fourth Quarter and Full Year 2024 Operational Highlights:
User Base
- Total number of registered users reached 228 million as of December 31, 2024, representing an increase of 8.6% from 210 million as of December 31, 2023, and users with credit lines reached 45.1 million as of December 31, 2024, up by 6.8% from 42.3 million as of December 31, 2023.
- Number of active users1 who used our loan products in the fourth quarter of 2024 was 4.7 million, representing a decrease of 0.7% from 4.7 million in the fourth quarter of 2023. Number of active users1 who used our loan products in 2024 was 8.2 million, representing a decrease of 4.3% from 8.5 million in 2023.
- Number of cumulative borrowers with successful drawdown was 33.8 million as of December 31, 2024, an increase of 7.1% from 31.5 million as of December 31, 2023.
Loan Facilitation Business
- As of December 31, 2024, we cumulatively originated RMB1,325.1 billion in loans, an increase of 19.1% from RMB1,113.1 billion as of December 31, 2023.
- Total loan originations2 in the fourth quarter of 2024 was RMB52.0 billion, a decrease of 15.2% from RMB61.2 billion in the fourth quarter of 2023. Total loan originations2 in 2024 was RMB212 billion, a decrease of 15.0% from RMB250 billion in 2023.
- Total outstanding principal balance of loans3 reached RMB110 billion as of December 31, 2024, representing a decrease of 11.1% from RMB124 billion as of December 31, 2023.
Credit Performance4
- 90 day+ delinquency ratio was 3.6% as of December 31, 2024, as compared with 3.7% as of September 30, 2024.
- First payment default rate (30 day+) for new loan originations was below 1% as of December 31, 2024.
Tech-empowerment Service
- For the fourth quarter of 2024, we served over 100 business customers with our tech-empowerment service.
- In the fourth quarter of 2024, the business customer retention rate5 of our tech-empowerment service was over 80%.
Installment E-commerce Platform Service
- GMV6in the fourth quarter of 2024 for our installment e-commerce platform service was RMB969 million, representing a decrease of 25.0% from RMB1,292 million in the fourth quarter of 2023. GMV6in 2024 for our installment e-commerce platform service was RMB3,633 million, representing a decrease of 31.3% from RMB5,289 million in 2023.
- In the fourth quarter of 2024, our installment e-commerce platform service served over 280,000 users and 400 merchants.
Other Operational Highlights
- The weighted average tenor of loans originated on our platform in the fourth quarter of 2024 was approximately 13.1 months, as compared with 12.3 months in the fourth quarter of 2023. The weighted average tenor of loans originated on our platform in 2024 was approximately 12.9 months, as compared with 13.8 months in 2023.
- Repeated borrowers’ contribution7 of loans across our platform for the fourth quarter of 2024 was 85.3%. Repeated borrowers’ contribution7 of loans across our platform for 2024 was 85.7%.
Fourth Quarter 2024 Financial Highlights:
- Total operating revenue was RMB3,659 million, representing an increase of 4.3% from the fourth quarter of 2023.
- Credit facilitation service income was RMB2,712 million, representing a decrease of 0.5% from the fourth quarter of 2023. Tech-empowerment service income was RMB602 million, representing an increase of 41.0% from the fourth quarter of 2023. Installment e-commerce platform service income was RMB345 million, representing a decrease of 2.9% from the fourth quarter of 2023.
- Net income attributable to ordinary shareholders of the Company was RMB363 million, representing an increase of over 100% from the fourth quarter of 2023. Net income per ADS attributable to ordinary shareholders of the Company was RMB2.06 on a fully diluted basis.
- Adjusted net income attributable to ordinary shareholders of the Company8 was RMB391 million, representing an increase of 37.7% from the fourth quarter of 2023. Adjusted net income per ADS attributable to ordinary shareholders of the Company8 was RMB2.22 on a fully diluted basis.
Full Year 2024 Financial Highlights:
- Total operating revenue was RMB14,204 million, representing an increase of 8.8% from 2023.
- Credit facilitation service income was RMB11,000 million, representing an increase of 13.8% from 2023. Tech-empowerment service income was RMB1,881 million, representing an increase of 14.7% from 2023. Installment e-commerce platform service income was RMB1,322 million, representing a decrease of 24.5% from 2023.
- Net income attributable to ordinary shareholders of the Company was RMB1,100 million, representing an increase of 3.2% from 2023. Net income per ADS attributable to ordinary shareholders of the Company was RMB6.49 on a fully diluted basis.
- Adjusted net income attributable to ordinary shareholders of the Company8 was RMB1,203 million, representing a decrease of 19.0% from 2023. Adjusted net income per ADS attributable to ordinary shareholders of the Company8 was RMB7.09 on a fully diluted basis.
__________________________
- Active users refer to, for a specified period, users who made at least one transaction during that period through our platform or through our third-party partners’ platforms using the credit line granted by us.
- Total loan originations refer to the total principal amount of loans facilitated and originated during the given period.
- Total outstanding principal balance of loans refers to the total amount of principal outstanding for loans facilitated and originated at the end of each period, excluding loans delinquent for more than 180 days.
- Loans under Intelligent Credit Platform are excluded from the calculation of credit performance. Intelligent Credit Platform (ICP) is an intelligent platform on our “Fenqile” app, under which we match borrowers and financial institutions through big data and cloud computing technology. For loans facilitated through ICP, the Company does not bear principal risk.
- Customer retention rate refers to the number of financial institution customers and partners who repurchase our service in the current quarter as a percentage of the total number of financial institution customers and partners in the preceding quarter.
- GMV refers to the total value of transactions completed for products purchased on our e-commerce and Maiya channel, net of returns.
- Repeated borrowers’ contribution for a given period refers to the principal amount of loans borrowed during that period by borrowers who had previously made at least one successful drawdown as a percentage of the total loan facilitation and origination volume through our platform during that period.
- Adjusted net income attributable to ordinary shareholders of the Company, adjusted net income per ordinary share and per ADS attributable to ordinary shareholders of the Company are non-GAAP financial measures. For more information on non-GAAP financial measures, please see the section of “Use of Non-GAAP Financial Measures Statement” and the tables captioned “Unaudited Reconciliations of GAAP and Non-GAAP Results” set forth at the end of this press release.
Fourth Quarter 2024 Financial Results:
Operating revenue increased by 4.3% from RMB3,509 million in the fourth quarter of 2023 to RMB3,659 million in the fourth quarter of 2024.
Credit facilitation service incomewas RMB2,712 million in the fourth quarter of 2024 as compared to RMB2,727 million in the fourth quarter of 2023. The decrease was driven by the decrease in guarantee income, partially offset by the increases in loan facilitation and servicing fees-credit oriented and financing income.
Loan facilitation and servicing fees-credit oriented increased by 4.2% from RMB1,559 million in the fourth quarter of 2023 to RMB1,624 million in the fourth quarter of 2024. The increase was primarily driven by the increase in takerate of loan facilitation business.
Guarantee income decreased by 18.6% from RMB709 million in the fourth quarter of 2023 to RMB577 million in the fourth quarter of 2024. The decrease was primarily due to the decrease of outstanding balances in the off-balance sheet loans funded by certain institutional funding partners, which are accounted for under ASC 460, Guarantees.
Financing income increased by 11.2% from RMB459 million in the fourth quarter of 2023 to RMB510 million in the fourth quarter of 2024. The increase was primarily driven by the increase in the origination of on-balance sheet loans.
Tech-empowerment service income increased by 41.0% from RMB427 million in the fourth quarter of 2023 to RMB602 million in the fourth quarter of 2024. The increase was primarily driven by the increase of loan facilitation volume through ICP.
Installment e-commerce platform service income was RMB345 million in the fourth quarter of 2024, as compared to RMB356 million in the fourth quarter of 2023.
Cost of sales was RMB353 million in the fourth quarter of 2024, as compared to RMB344 million in the fourth quarter of 2023.
Funding costdecreased by 24.6% from RMB76.2 million in the fourth quarter of 2023 to RMB57.5 million in the fourth quarter of 2024, which was primarily driven by the decrease in the cost of funding to fund the on-balance sheet loans.
Processing and servicing costs increased by 13.4% from RMB514 million in the fourth quarter of 2023 to RMB583 million in the fourth quarter of 2024. This increase was primarily due to an increase in risk management and collection expenses.
Provision for financing receivables was RMB297 million for the fourth quarter of 2024, as compared to RMB180 million for the fourth quarter of 2023. The increase was primarily due to the increase of the outstanding loan balances of on-balance sheet loans.
Provision for contract assets and receivables was RMB154 million in the fourth quarter of 2024, as compared to RMB203 million in the fourth quarter of 2023. The decrease was primarily driven by the decrease of the outstanding loan balances of off-balance sheet loans.
Provision for contingent guarantee liabilities was RMB941 million in the fourth quarter of 2024, as compared to RMB934 million in the fourth quarter of 2023.
Gross profit was RMB1,274 million in the fourth quarter of 2024, as compared to RMB1,258 million in the fourth quarter of 2023.
Sales and marketing expenses was RMB464 million in the fourth quarter of 2024, as compared to RMB430 million in the fourth quarter of 2023. This increase was primarily due to an increase in online advertising costs.
Research and development expenses was RMB151 million in the fourth quarter of 2024, as compared to RMB136 million in the fourth quarter of 2023. The increase was primarily due to increased investment in technology development.
General and administrative expenses decreased by 12.0% from RMB108 million in the fourth quarter of 2023 to RMB95.3 million in the fourth quarter of 2024, primarily as a result of the Company’s expense control measures.
Change in fair value of financial guarantee derivatives and loans at fair valuewas a loss of RMB144 million in the fourth quarter of 2024, as compared to a loss of RMB248 million in the fourth quarter of 2023. The change was primarily due to the fair value loss from the re-measurement of the expected loss rates, partially offset by the fair value gains realized as a result of the release of guarantee obligation.
Income tax expensewas RMB67.6 million in the fourth quarter of 2024, as compared to income tax benefit of RMB9.7 million in the fourth quarter of 2023. The change was primarily due to the increase of income before income tax expense.
Net income increased over 100% from RMB12.1 million in the fourth quarter of 2023 to RMB363 million in the fourth quarter of 2024.
Full Year 2024 Financial Results:
Operating revenue increased by 8.8% from RMB13,057 million in 2023 to RMB14,204 million in 2024.
Credit facilitation service incomeincreased by 13.8% from RMB9,666 million in 2023 to RMB11,000 million in 2024. The increase was driven by the increases in loan facilitation and servicing fees-credit oriented and guarantee income, partially offset by the decrease in financing income.
Loan facilitation and servicing fees-credit oriented increased by 26.5% from RMB5,002 million in 2023 to RMB6,326 million in 2024. The increase was primarily due to the increase in takerate of loan facilitation business.
Guarantee income increased by 5.7% from RMB2,519 million in 2023 to RMB2,664 million in 2024. The increase was primarily due to the increase in cumulative loan origination funded by certain institutional funding partners, which are accounted for under ASC 460, Guarantees.
Financing income decreased by 6.3% from RMB2,145 million in 2023 to RMB2,010 million in 2024. The decrease was primarily due to the decrease in the origination of on-balance sheet loans.
Tech-empowerment service income increased by 14.7% from RMB1,640 million in 2023 to RMB1,881 million in 2024. The increase was primarily due to the increase of loan facilitation volume through ICP.
Installment e-commerce platform service income decreased by 24.5% from RMB1,751 million in 2023 to RMB1,322 million in 2024. The decrease was primarily due to the decrease in transaction volume in 2024.
Cost of sales decreased by 19.3% from RMB1,636 million in 2023 to RMB1,320 million in 2024, which was consistent with the decrease in installment e-commerce platform service income.
Funding costdecreased by 36.5% from RMB514 million in 2023 to RMB326 million in 2024, which was primarily driven by the decrease in the cost of funding to fund the on-balance sheet loans.
Processing and servicing costs increased by 18.4% from RMB1,935 million in 2023 to RMB2,292 million in 2024. This increase was primarily due to an increase in risk management and collection expenses.
Provision for financing receivables was RMB866 million in 2024, as compared to RMB627 million in 2023. The increase was primarily due to the increase of the outstanding loan balances of on-balance sheet loans.
Provision for contract assets and receivables was RMB718 million in 2024, as compared to RMB629 million in 2023. The increase was primarily due to the increase of the outstanding loan balances of off-balance sheet loans.
Provision for contingent guarantee liabilities was RMB3,656 million in 2024, as compared to RMB3,203 million in 2023. The fluctuation was primarily due to the re-measurement of the expected loss rates, which are accounted for under ASC 460, Guarantees.
Gross profit increased by 11.4% from RMB4,513 million in 2023 to RMB5,026 million in 2024.
Sales and marketing expenses was RMB1,787 million in 2024, as compared to RMB1,733 million in 2023.
Research and development expenses was RMB578 million in the quarter of 2024, as compared to RMB513 million in 2023. The increase was primarily due to increased investment in technology development.
General and administrative expenses was RMB374 million in 2024, as compared to RMB387 million in 2023.
Change in fair value of financial guarantee derivatives and loans at fair valuewas a loss of RMB979 million in 2024, as compared to a loss of RMB206 million in 2023. The change was primarily due to the fair value loss from the re-measurement of the expected loss rates, partially offset by the fair value gains realized as a result of the release of guarantee obligation.
Income tax expensewas RMB253 million in 2024, as compared to RMB261 million in 2023. The change was primarily due to the decrease of effective tax rate.
Net income increased by 3.2% from RMB1,066 million in 2023 to RMB1,100 million in the 2024.
Recent Development
Semi-Annual Dividend
The board of directors of the Company has approved a dividend of US$0.055 per ordinary share, or US$0.11 per ADS, for the six-month period ended December 31, 2024 in accordance with the Company’s dividend policy, which is expected to be paid on May 16, 2025 to shareholders of record (including holders of ADSs) as of the close of business on April 17, 2025 New York time.
Outlook
Looking ahead, while our performance continues to demonstrate positive momentum, we remain prudent in light of ongoing macroeconomic uncertainties. Therefore, for full year 2025, we expect total loan origination to have flat to single-digit year-on-year growth depending on the macroeconomic conditions, alongside a significant increase in net income driven by continuing improvement in asset quality. These forecasts are subject to the impact of macroeconomic factors, and the company may adjust its performance outlook as appropriate based on evolving circumstances.
Conference Call
The Company’s management will host an earnings conference call at 10:00 PM U.S. Eastern time on March 18, 2025 (10:00 AM Beijing/Hong Kong time on March 19, 2025).
Participants who wish to join the conference call should register online at:
https://register-conf.media-server.com/register/BI6702756dbdb741f9b401c583a37bd291
Once registration is completed, each participant will receive the dial-in number and a unique access PIN for the conference call.
Participants joining the conference call should dial in at least 10 minutes before the scheduled start time.
A live and archived webcast of the conference call will also be available at the Company 's investor relations website at http://ir.lexin.com.
About LexinFintech Holdings Ltd.
We are a leading credit technology-empowered personal financial service enabler. Our mission is to use technology and risk management expertise to make financing more accessible for young generation consumers. We strive to achieve this mission by connecting consumers with financial institutions, where we facilitate through a unique model that includes online and offline channels, installment consumption platform, big data and AI driven credit risk management capabilities, as well as smart user and loan management systems. We also empower financial institutions by providing cutting-edge proprietary technology solutions to meet their needs of financial digital transformation.
For more information, please visit http://ir.lexin.com.
To follow us on Twitter, please go to: https://twitter.com/LexinFintech.
Use of Non-GAAP Financial Measures Statement
In evaluating our business, we consider and use adjusted net income attributable to ordinary shareholders of the Company, non-GAAP EBIT, adjusted net income per ordinary share and per ADS attributable to ordinary shareholders of the Company, four non-GAAP measures, as supplemental measures to review and assess our operating performance. The presentation of the non-GAAP financial measures is not intended to be considered in isolation or as a substitute for the financial information prepared and presented in accordance with U.S. GAAP. We define adjusted net income attributable to ordinary shareholders of the Company as net income attributable to ordinary shareholders of the Company excluding share-based compensation expenses, interest expense associated with convertible notes, and investment income/(loss) and we define non-GAAP EBIT as net income excluding income tax expense, share-based compensation expenses, interest expense, net, and investment income/(loss).
We present these non-GAAP financial measures because they are used by our management to evaluate our operating performance and formulate business plans. Adjusted net income attributable to ordinary shareholders of the Company enables our management to assess our operating results without considering the impact of share-based compensation expenses, interest expense associated with convertible notes, and investment income/(loss). Non-GAAP EBIT, on the other hand, enables our management to assess our operating results without considering the impact of income tax expense, share-based compensation expenses, interest expense, net, and investment income/(loss). We also believe that the use of these non-GAAP financial measures facilitates investors’ assessment of our operating performance. These non-GAAP financial measures are not defined under U.S. GAAP and are not presented in accordance with U.S. GAAP.
These non-GAAP financial measures have limitations as an analytical tool. One of the key limitations of using adjusted net income attributable to ordinary shareholders of the Company and non-GAAP EBIT is that they do not reflect all items of income and expense that affect our operations. Share-based compensation expenses, interest expense associated with convertible notes, income tax expense, interest expense, net, and investment income/(loss) have been and may continue to be incurred in our business and are not reflected in the presentation of adjusted net income attributable to ordinary shareholders of the Company and non-GAAP EBIT. Further, these non-GAAP financial measures may differ from the non-GAAP financial information used by other companies, including peer companies, and therefore their comparability may be limited.
We compensate for these limitations by reconciling each of the non-GAAP financial measures to the most directly comparable U.S. GAAP financial measure, which should be considered when evaluating our performance. We encourage you to review our financial information in its entirety and not rely on a single financial measure.
Exchange Rate Information Statement
This announcement contains translations of certain RMB amounts into U.S. dollars (“US$”) at specified rates solely for the convenience of the reader. Unless otherwise stated, all translations from RMB to US$ were made at the rate of RMB7.2993 to US$1.00, the exchange rate set forth in the H.10 statistical release of the Federal Reserve Board on December 31, 2024. The Company makes no representation that the RMB or US$ amounts referred could be converted into US$ or RMB, as the case may be, at any particular rate or at all.
Safe Harbor Statement
This announcement contains forward-looking statements. These statements are made under the “safe harbor” provisions of the U.S. Private Securities Litigation Reform Act of 1995. Statements that are not historical facts, including statements about Lexin’s beliefs and expectations, are forward-looking statements. These forward-looking statements can be identified by terminology such as “will,” “ expects,” “anticipates,” “future,” “intends,” “plans,” “believes,” “estimates,” “confident” and similar statements. Among other things, the expectation of the collection efficiency and delinquency, business outlook and quotations from management in this announcement, contain forward-looking statements. Lexin may also make written or oral forward-looking statements in its periodic reports to the U.S. Securities and Exchange Commission (the “SEC”), in its annual report to shareholders, in press releases and other written materials and in oral statements made by its officers, directors or employees to third parties. Forward-looking statements involve inherent risks and uncertainties. A number of factors could cause actual results to differ materially from those contained in any forward-looking statement, including but not limited to the following: Lexin’s goal and strategies; Lexin’s expansion plans; Lexin’s future business development, financial condition and results of operations; Lexin’s expectation regarding demand for, and market acceptance of, its credit and investment management products; Lexin’s expectations regarding keeping and strengthening its relationship with borrowers, institutional funding partners, merchandise suppliers and other parties it collaborates with; general economic and business conditions; and assumptions underlying or related to any of the foregoing. Further information regarding these and other risks is included in Lexin’s filings with the SEC. All information provided in this press release and in the attachments is as of the date of this press release, and Lexin does not undertake any obligation to update any forward-looking statement, except as required under applicable law.
For investor and media inquiries, please contact:
LexinFintech Holdings Ltd.
IR inquiries:
Will Tan
Tel: +86 (755) 3637-8888 ext. 6258
E-mail: willtan@lexin.com
Media inquiries:
Ruifeng Xu
Tel: +86 (755) 3637-8888 ext. 6993
E-mail: media@lexin.com
SOURCE LexinFintech Holdings Ltd.
| LexinFintech Holdings Ltd. Unaudited Condensed Consolidated Balance Sheets | |||||||||
| As of | |||||||||
| (In thousands) | December 31, 2023 | December 31, 2024 | |||||||
| RMB | RMB | US$ | |||||||
| ASSETS | |||||||||
| Current Assets | |||||||||
| Cash and cash equivalents | 2,624,719 | 2,254,213 | 308,826 | ||||||
| Restricted cash | 1,433,502 | 1,638,479 | 224,471 | ||||||
| Restricted term deposit and short-term investments | 305,182 | 138,497 | 18,974 | ||||||
| Short-term financing receivables, net(1) | 3,944,000 | 4,668,715 | 639,611 | ||||||
| Short-term contract assets and receivables, net(1) | 6,112,981 | 5,448,057 | 746,381 | ||||||
| Deposits to insurance companies and guarantee companies | 2,613,271 | 2,355,343 | 322,681 | ||||||
| Prepayments and other current assets | 1,428,769 | 1,321,340 | 181,024 | ||||||
| Amounts due from related parties | 6,989 | 61,722 | 8,456 | ||||||
| Inventories, net | 33,605 | 22,345 | 3,061 | ||||||
| Total Current Assets | 18,503,018 | 17,908,711 | 2,453,485 | ||||||
| Non-current Assets | |||||||||
| Restricted cash | 144,948 | 100,860 | 13,818 | ||||||
| Long-term financing receivables, net(1) | 200,514 | 112,427 | 15,402 | ||||||
| Long-term contract assets and receivables, net(1) | 599,818 | 317,402 | 43,484 | ||||||
| Property, equipment and software, net | 446,640 | 613,110 | 83,996 | ||||||
| Land use rights, net | 897,267 | 862,867 | 118,212 | ||||||
| Long‑term investments | 255,003 | 284,197 | 38,935 | ||||||
| Deferred tax assets | 1,232,092 | 1,540,842 | 211,094 | ||||||
| Other assets | 861,491 | 500,363 | 68,549 | ||||||
| Total Non-current Assets | 4,637,773 | 4,332,068 | 593,490 | ||||||
| TOTAL ASSETS | 23,140,791 | 22,240,779 | 3,046,975 | ||||||
| LIABILITIES | |||||||||
| Current liabilities | |||||||||
| Accounts payable | 49,801 | 74,443 | 10,199 | ||||||
| Amounts due to related parties | 2,958 | 10,927 | 1,497 | ||||||
| Short‑term borrowings | 502,013 | 690,772 | 94,635 | ||||||
| Short‑term funding debts | 3,483,196 | 2,754,454 | 377,359 | ||||||
| Deferred guarantee income | 1,538,385 | 975,102 | 133,588 | ||||||
| Contingent guarantee liabilities | 1,808,540 | 1,079,000 | 147,822 | ||||||
| Accruals and other current liabilities | 4,434,254 | 4,019,676 | 550,691 | ||||||
| Convertible notes | 505,450 | - | - | ||||||
| Total Current Liabilities | 12,324,597 | 9,604,374 | 1,315,791 | ||||||
| Non-current Liabilities | |||||||||
| Long-term borrowings | 524,270 | 585,024 | 80,148 | ||||||
| Long‑term funding debts | 455,800 | 1,197,211 | 164,017 | ||||||
| Deferred tax liabilities | 75,340 | 91,380 | 12,519 | ||||||
| Other long-term liabilities | 50,702 | 22,784 | 3,121 | ||||||
| Total Non-current Liabilities | 1,106,112 | 1,896,399 | 259,805 | ||||||
| TOTAL LIABILITIES | 13,430,709 | 11,500,773 | 1,575,596 | ||||||
| Shareholders’ equity: | |||||||||
| Class A Ordinary Shares | 199 | 205 | 31 | ||||||
| Class B Ordinary Shares | 41 | 41 | 7 | ||||||
| Treasury stock | (328,764 | ) | (328,764 | ) | (45,040 | ) | |||
| Additional paid-in capital | 3,204,961 | 3,314,866 | 454,134 | ||||||
| Statutory reserves | 1,106,579 | 1,178,309 | 161,428 | ||||||
| Accumulated other comprehensive income | (13,545 | ) | (29,559 | ) | (4,050 | ) | |||
| Retained earnings | 5,740,611 | 6,604,908 | 904,869 | ||||||
| Total shareholders’ equity | 9,710,082 | 10,740,006 | 1,471,379 | ||||||
| TOTAL LIABILITIES AND SHAREHOLDERS’ EQUITY | 23,140,791 | 22,240,779 | 3,046,975 |
__________________________
(1) Short-term financing receivables, net of allowance for credit losses of RMB58,594 and RMB102,124 as of December 31, 2023 and December 31, 2024, respectively.
Short-term contract assets and receivables, net of allowance for credit losses of RMB436,136 and RMB409,590 as of December 31, 2023 and December 31, 2024, respectively.
Long-term financing receivables, net of allowance for credit losses of RMB3,087 and RMB1,820 as of December 31, 2023 and December 31, 2024, respectively.
Long-term contract assets and receivables, net of allowance for credit losses of RMB61,838 and RMB30,919 as of December 31, 2023 and December 31, 2024, respectively.
| LexinFintech Holdings Ltd. Unaudited Condensed Consolidated Statements of Operations | ||||||||||||||||||
| For the Three Months Ended December 31, | For the Year Ended December 31, | |||||||||||||||||
| (In thousands, except for share and per share data) | 2023 | 2024 | 2023 | 2024 | ||||||||||||||
| RMB | RMB | US$ | RMB | RMB | US$ | |||||||||||||
| Operating revenue: | ||||||||||||||||||
| Credit facilitation service income | 2,727,020 | 2,712,066 | 371,552 | 9,666,120 | 10,999,931 | 1,506,984 | ||||||||||||
| Loan facilitation and servicing fees-credit oriented | 1,558,588 | 1,624,410 | 222,543 | 5,001,881 | 6,325,924 | 866,648 | ||||||||||||
| Guarantee income | 709,422 | 577,168 | 79,072 | 2,519,284 | 2,663,824 | 364,942 | ||||||||||||
| Financing income | 459,010 | 510,488 | 69,937 | 2,144,955 | 2,010,183 | 275,394 | ||||||||||||
| Tech-empowerment service income | 426,882 | 601,693 | 82,432 | 1,640,453 | 1,881,376 | 257,747 | ||||||||||||
| Installment e-commerce platform service income | 355,534 | 345,074 | 47,275 | 1,750,509 | 1,322,287 | 181,153 | ||||||||||||
| Total operating revenue | 3,509,436 | 3,658,833 | 501,259 | 13,057,082 | 14,203,594 | 1,945,884 | ||||||||||||
| Operating cost | ||||||||||||||||||
| Cost of sales | (344,088 | ) | (352,749 | ) | (48,326 | ) | (1,635,635 | ) | (1,319,526 | ) | (180,774 | ) | ||||||
| Funding cost | (76,195 | ) | (57,471 | ) | (7,873 | ) | (513,869 | ) | (326,451 | ) | (44,724 | ) | ||||||
| Processing and servicing cost | (514,070 | ) | (583,119 | ) | (79,887 | ) | (1,935,016 | ) | (2,291,904 | ) | (313,990 | ) | ||||||
| Provision for financing receivables | (180,475 | ) | (296,741 | ) | (40,653 | ) | (627,061 | ) | (865,524 | ) | (118,576 | ) | ||||||
| Provision for contract assets and receivables | (202,677 | ) | (153,968 | ) | (21,094 | ) | (629,308 | ) | (718,413 | ) | (98,422 | ) | ||||||
| Provision for contingent guarantee liabilities | (933,854 | ) | (940,740 | ) | (128,881 | ) | (3,203,123 | ) | (3,655,548 | ) | (500,808 | ) | ||||||
| Total operating cost | (2,251,359 | ) | (2,384,788 | ) | (326,714 | ) | (8,544,012 | ) | (9,177,366 | ) | (1,257,294 | ) | ||||||
| Gross profit | 1,258,077 | 1,274,045 | 174,545 | 4,513,070 | 5,026,228 | 688,590 | ||||||||||||
| Operating expenses: | ||||||||||||||||||
| Sales and marketing expenses | (429,573 | ) | (464,263 | ) | (63,604 | ) | (1,733,301 | ) | (1,787,299 | ) | (244,859 | ) | ||||||
| Research and development expenses | (135,837 | ) | (151,081 | ) | (20,698 | ) | (513,284 | ) | (578,243 | ) | (79,219 | ) | ||||||
| General and administrative expenses | (108,305 | ) | (95,335 | ) | (13,061 | ) | (387,387 | ) | (374,481 | ) | (51,304 | ) | ||||||
| Total operating expenses | (673,715 | ) | (710,679 | ) | (97,363 | ) | (2,633,972 | ) | (2,740,023 | ) | (375,382 | ) | ||||||
| Change in fair value of financial guarantee derivatives and loans at fair value | (247,526 | ) | (143,619 | ) | (19,676 | ) | (206,368 | ) | (979,234 | ) | (134,155 | ) | ||||||
| Interest expense, net | (10,245 | ) | (2,560 | ) | (351 | ) | (50,483 | ) | (9,007 | ) | (1,234 | ) | ||||||
| Investment loss | (302,128 | ) | (543 | ) | (74 | ) | (303,235 | ) | (2,417 | ) | (331 | ) | ||||||
| Others, net | (22,092 | ) | 13,754 | 1,884 | 7,774 | 58,188 | 7,972 | |||||||||||
| Income before income tax expense | 2,371 | 430,398 | 58,965 | 1,326,786 | 1,353,735 | 185,460 | ||||||||||||
| Income tax benefit/(expense) | 9,726 | (67,649 | ) | (9,268 | ) | (260,841 | ) | (253,275 | ) | (34,699 | ) | |||||||
| Net income | 12,097 | 362,749 | 49,697 | 1,065,945 | 1,100,460 | 150,761 | ||||||||||||
| Net income attributable to ordinary shareholders of the Company | 12,097 | 362,749 | 49,697 | 1,065,945 | 1,100,460 | 150,761 | ||||||||||||
| Net income per ordinary share attributable to ordinary shareholders of the Company | ||||||||||||||||||
| Basic | 0.04 | 1.09 | 0.15 | 3.24 | 3.32 | 0.45 | ||||||||||||
| Diluted | 0.04 | 1.03 | 0.14 | 3.17 | 3.24 | 0.44 | ||||||||||||
| Net income per ADS attributable to ordinary shareholders of the Company | ||||||||||||||||||
| Basic | 0.07 | 2.18 | 0.30 | 6.49 | 6.64 | 0.91 | ||||||||||||
| Diluted | 0.07 | 2.06 | 0.28 | 6.34 | 6.49 | 0.89 | ||||||||||||
| Weighted average ordinary shares outstanding | ||||||||||||||||||
| Basic | 329,297,640 | 333,182,976 | 333,182,976 | 328,523,952 | 331,403,936 | 331,403,936 | ||||||||||||
| Diluted | 331,941,385 | 351,577,582 | 351,577,582 | 359,820,982 | 339,261,349 | 339,261,349 |
| LexinFintech Holdings Ltd. Unaudited Condensed Consolidated Statements of Comprehensive Income | |||||||||||||||||||
| For the Three Months Ended December 31, | For the Year Ended December 31, | ||||||||||||||||||
| (In thousands) | 2023 | 2024 | 2023 | 2024 | |||||||||||||||
| RMB | RMB | US$ | RMB | RMB | US$ | ||||||||||||||
| Net income | 12,097 | 362,749 | 49,697 | 1,065,945 | 1,100,460 | 150,761 | |||||||||||||
| Other comprehensive income | |||||||||||||||||||
| Foreign currency translation adjustment, net of nil tax | 27,841 | 642 | 88 | 7,297 | (16,014 | ) | (2,194 | ) | |||||||||||
| Total comprehensive income | 39,938 | 363,391 | 49,785 | 1,073,242 | 1,084,446 | 148,567 | |||||||||||||
| Total comprehensive income attributable to ordinary shareholders of the Company | 39,938 | 363,391 | 49,785 | 1,073,242 | 1,084,446 | 148,567 |
| LexinFintech Holdings Ltd. Unaudited Reconciliations of GAAP and Non-GAAP Results | |||||||||||||||||||
| For the Three Months Ended December 31, | For the Year Ended December 31, | ||||||||||||||||||
| (In thousands, except for share and per share data) | 2023 | 2024 | 2023 | 2024 | |||||||||||||||
| RMB | RMB | US$ | RMB | RMB | US$ | ||||||||||||||
| Reconciliation of Adjusted net income attributable to ordinary shareholders of the Company to Net income attributable to ordinary shareholders of the Company | |||||||||||||||||||
| Net income attributable to ordinary shareholders of the Company | 12,097 | 362,749 | 49,697 | 1,065,945 | 1,100,460 | 150,761 | |||||||||||||
| Add: Share-based compensation expenses | 32,959 | 27,244 | 3,732 | 117,852 | 94,623 | 12,963 | |||||||||||||
| Interest expense associated with convertible notes | 11,943 | - | - | 73,807 | 5,695 | 780 | |||||||||||||
| Investment loss | 302,128 | 543 | 74 | 303,235 | 2,417 | 331 | |||||||||||||
| Tax effects on Non-GAAP adjustments (2) | (75,440 | ) | - | - | (75,440 | ) | - | - | |||||||||||
| Adjusted net income attributable to ordinary shareholders of the Company | 283,687 | 390,536 | 53,503 | 1,485,399 | 1,203,195 | 164,835 | |||||||||||||
| Adjusted net income per ordinary share attributable to ordinary shareholders of the Company | |||||||||||||||||||
| Basic | 0.86 | 1.17 | 0.16 | 4.52 | 3.63 | 0.50 | |||||||||||||
| Diluted | 0.82 | 1.11 | 0.15 | 4.13 | 3.55 | 0.49 | |||||||||||||
| Adjusted net income per ADS attributable to ordinary shareholders of the Company | |||||||||||||||||||
| Basic | 1.72 | 2.34 | 0.32 | 9.04 | 7.26 | 0.99 | |||||||||||||
| Diluted | 1.64 | 2.22 | 0.30 | 8.26 | 7.09 | 0.97 | |||||||||||||
| Weighted average shares used in calculating net income per ordinary share for non-GAAP EPS | |||||||||||||||||||
| Basic | 329,297,640 | 333,182,976 | 333,182,976 | 328,523,952 | 331,403,936 | 331,403,936 | |||||||||||||
| Diluted | 345,913,435 | 351,577,582 | 351,577,582 | 359,820,982 | 339,261,349 | 339,261,349 | |||||||||||||
| Reconciliations of Non-GAAP EBIT to Net income | |||||||||||||||||||
| Net income | 12,097 | 362,749 | 49,697 | 1,065,945 | 1,100,460 | 150,761 | |||||||||||||
| Add: Income tax (benefit)/expense | (9,726 | ) | 67,649 | 9,268 | 260,841 | 253,275 | 34,699 | ||||||||||||
| Share-based compensation expenses | 32,959 | 27,244 | 3,732 | 117,852 | 94,623 | 12,963 | |||||||||||||
| Interest expense, net | 10,245 | 2,560 | 351 | 50,483 | 9,007 | 1,234 | |||||||||||||
| Investment loss | 302,128 | 543 | 74 | 303,235 | 2,417 | 331 | |||||||||||||
| Non-GAAP EBIT | 347,703 | 460,745 | 63,122 | 1,798,356 | 1,459,782 | 199,988 |
(2) To exclude the tax effects related to the investment loss
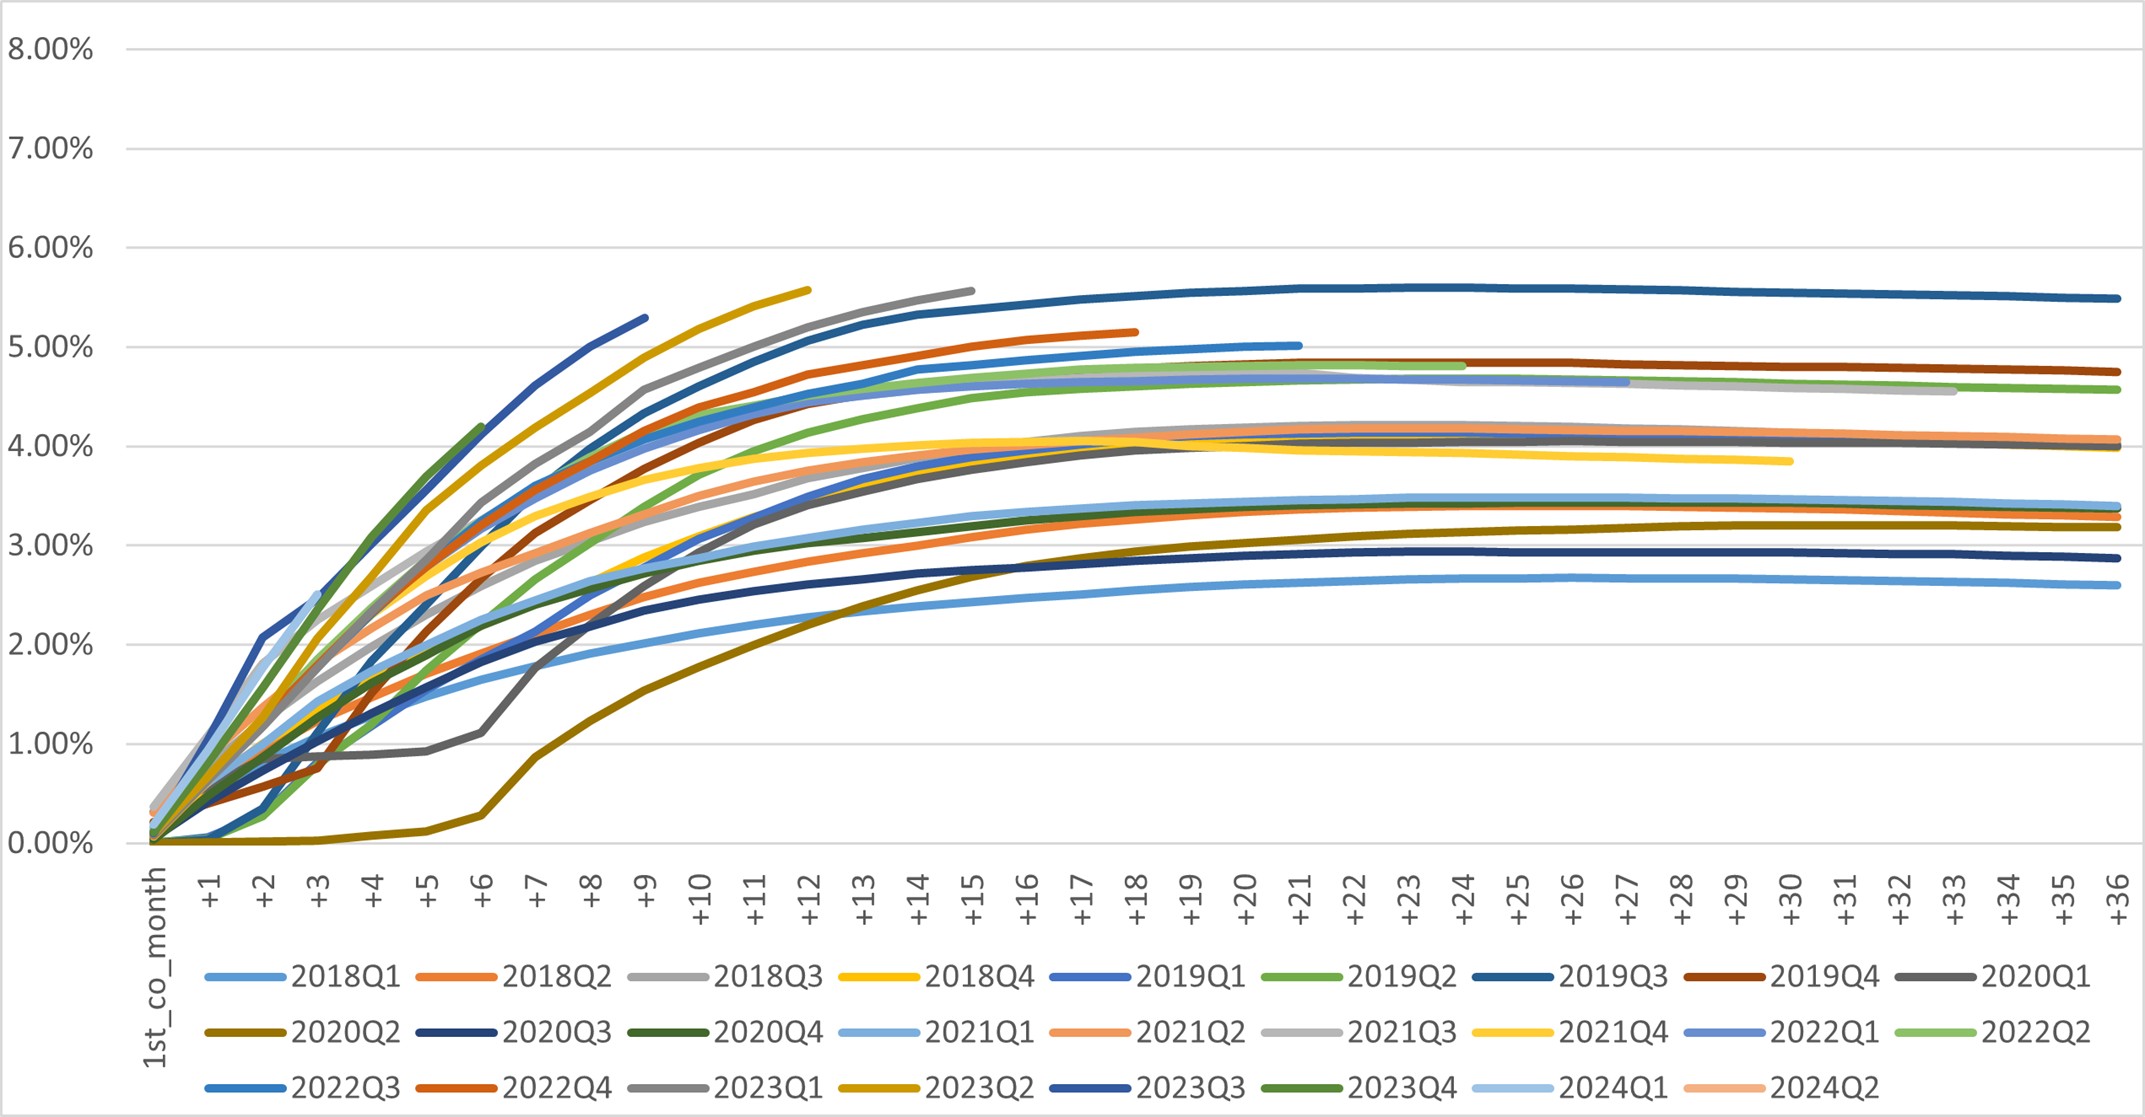
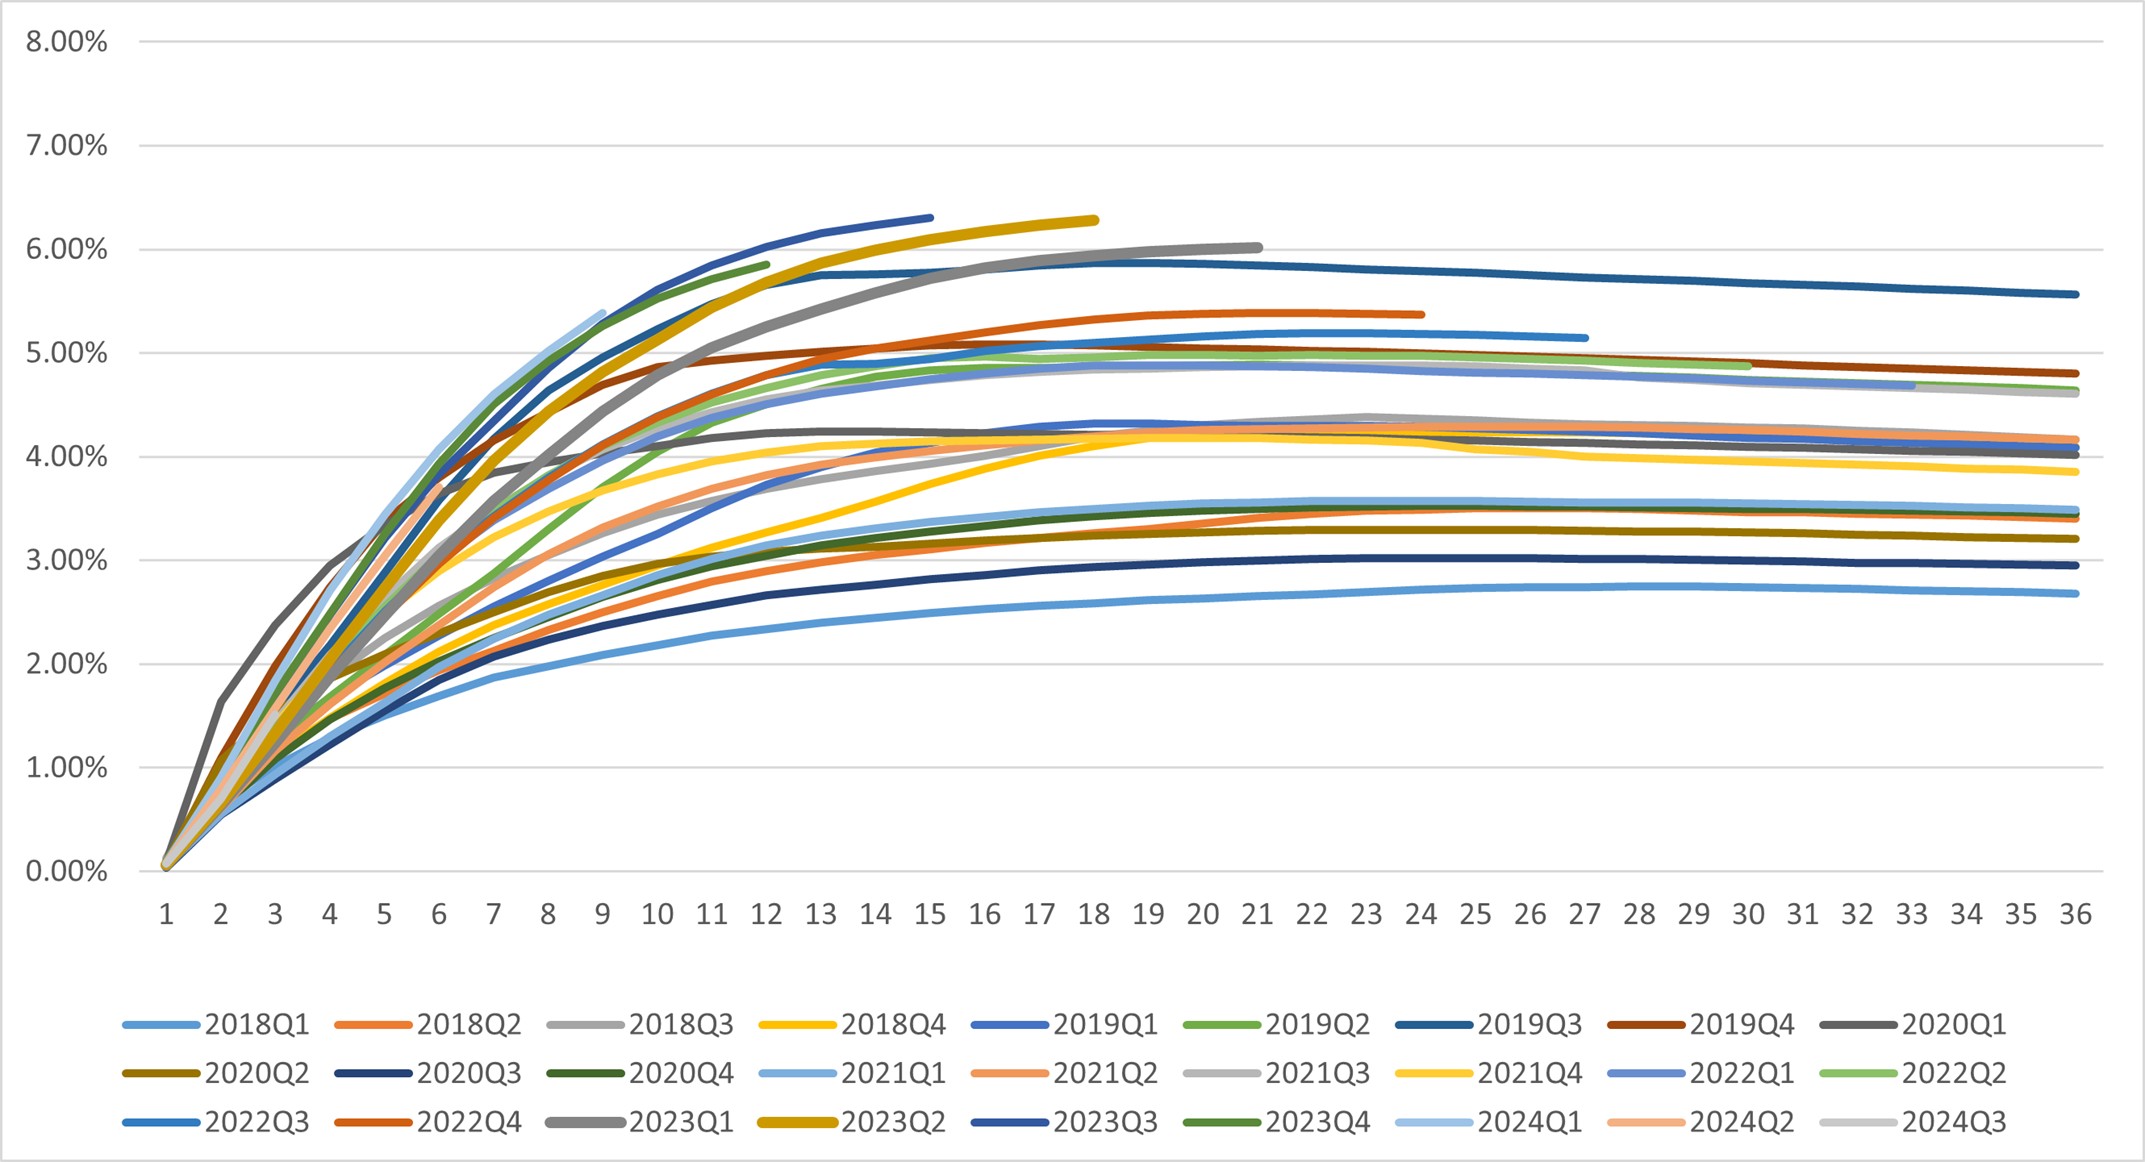
Additional Credit Information
Vintage Charge Off Curve1
Dpd30+/GMV by Performance Windows1
First Payment Default 30+1
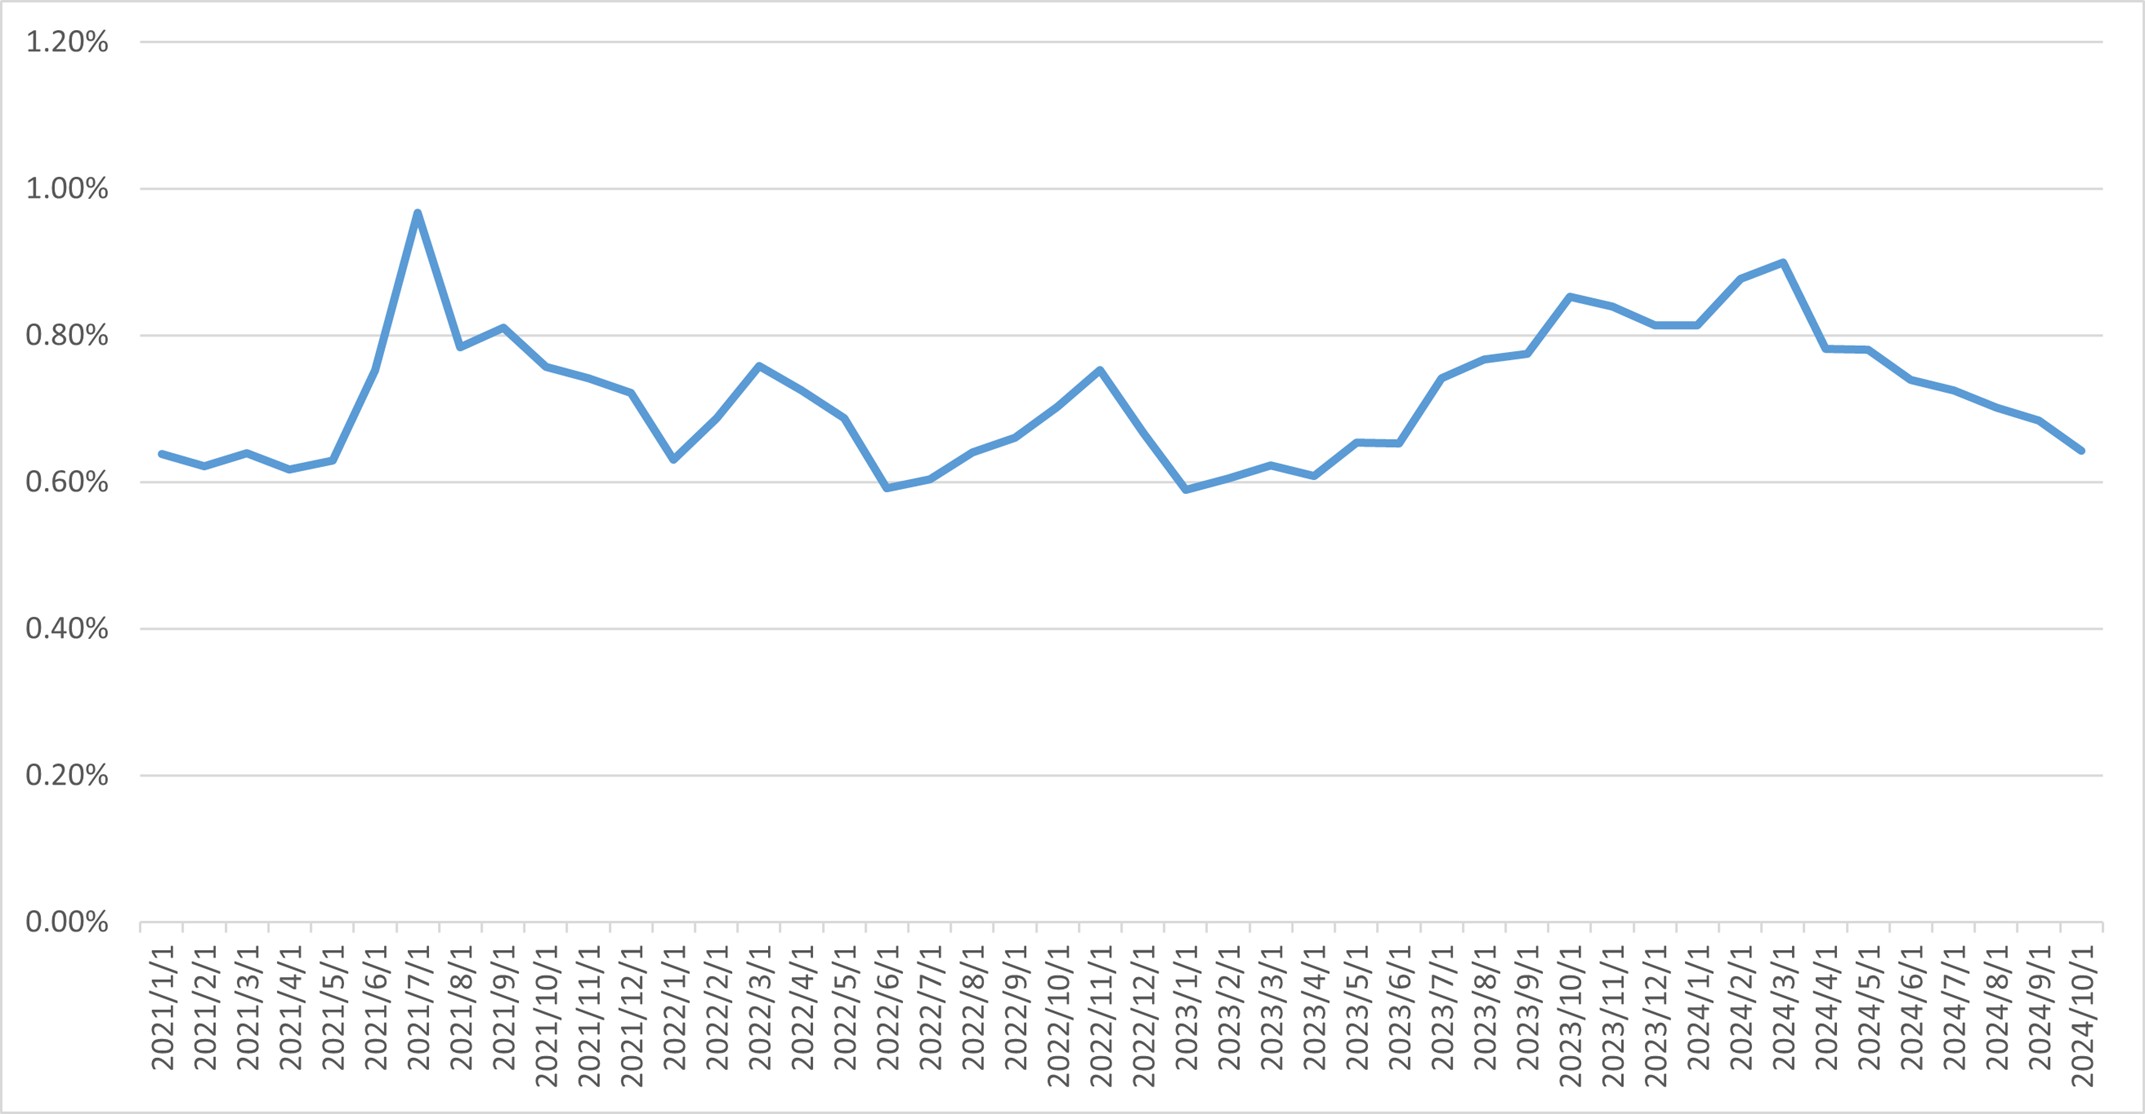
1. Loans facilitated under ICP are excluded from the chart.

© 2025 GlobeNewswire, Inc. All Rights Reserved.


