Chartwell Announces Strong Q2 2026 Results with Twelfth Consecutive Quarter of Double-Digit Growth in Funds from Operations per Unit
Chartwell Announces Strong Q2 2026 Results with Twelfth Consecutive Quarter of Double-Digit Growth in Funds from Operations per Unit |
| [06-August-2026] |
MISSISSAUGA, ON, Aug. 6, 2026 /CNW/ -- Chartwell Retirement Residences ("Chartwell") (TSX: CSH.UN) announced today its results for the three and six months ended June 30, 2026. Highlights Q2 2026 compared to Q2 2025:
"Our teams delivered another strong quarter in Q2 2026, with FFO per unit increasing 17% over Q2 2025, marking our twelfth consecutive quarter of double-digit growth in FFO per unit. During the quarter, we continued to execute our portfolio optimization strategy through acquisitions, developments and the disposition of non-core assets, further strengthening our presence in key growth markets with newer, more efficient communities. "The recent announcement of four development projects with our trusted partners representing 828 suites, reflects our commitment to leading the next phase of retirement residence development in Canada. Together, these investments will expand the supply of high-quality, purpose-built communities and increase choice for Canadian seniors as demand for retirement living continues to grow," said Vlad Volodarski, Chartwell's Chief Executive Officer. "These results reflect the commitment of our people across our residences and support offices to delivering exceptional experiences for our residents. I thank them for their hard work, passion and continued focus on the residents and families we have the privilege of serving." Results of Operations
For Q2 2026, property revenue increased $52.3 million or 19.5%, and direct property operating expense increased $27.5 million or 17.3%. For Q2 2026, net loss was $1.3 million compared to net loss of $5.7 million in Q2 2025 primarily due to:
partially offset by:
For Q2 2026, FFO was $90.5 million or $0.28 per unit, compared to $67.6 million or $0.24 per unit for Q2 2025. FFO does not include $2.8 million or $0.01 per unit of income guarantees related to recently acquired properties. The change in FFO was primarily due to:
partially offset by:
For 2026 YTD, property revenue increased $111.7 million or 21.8%, and direct property operating expense increased $56.7 million or 18.3%. For 2026 YTD, net income was $6.7 million compared to $27.5 million in 2025 YTD that included the gain on sale of $60.3 million due to the completed Welltower Transaction. The remaining differences are primarily due to:
partially offset by:
For 2026 YTD, FFO was $176.1 million or $0.54 per unit, compared to $123.7 million or $0.44 per unit for 2025 YTD. FFO does not include $6.0 million or $0.02 per unit of income guarantees related to recently acquired properties. The change in FFO was primarily due to:
partially offset by:
Financial Position
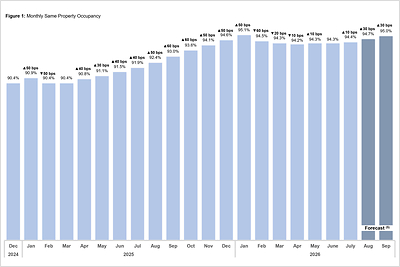
As at June 30, 2026, liquidity(1) amounted to $408.1 million, which included $38.1 million of cash and cash equivalents and $370.0 million of available borrowing capacity on our credit facilities. 2026 Outlook and Recent Developments An updated discussion of our business outlook can be found in the "2026 Outlook" section of our Management's Discussion and Analysis for the three months ended June 30, 2026 (the "Q2 2026 MD&A"). Operations Figure 1 provides an update in respect of our same property occupancy.
We experienced a seasonal occupancy dip during the 2026 winter that was more in-line with historical periods given severe weather conditions and a more pronounced flu season. We expect to see continued strong leasing activity given the robust industry supply and demand fundamentals and expect to achieve our full year average occupancy target of 95%. Portfolio Optimization Activities We continue to execute on our portfolio optimization strategy of enhancing our asset base to generate growing NOI, acquiring newer properties in core markets, selling non-core properties, repositioning underperforming properties and pursuing new developments. Recent activities include:
Liquidity and Financing As at August 6, 2026, liquidity amounted to $614.2 million, which included $219.2 million of cash and cash equivalents and $395.0 million of available borrowing capacity on our Credit Facility. As of the date of this release, for the remainder of 2026, we have $227.1 million of mortgage debt maturing with a weighted average interest rate of 2.8% and senior unsecured debentures of $250.0 million with an interest rate of 6.0%. At August 6, 2026, 10-year CMHC-insured mortgage rates are estimated at approximately 4.17% and five-year unsecured debenture rate to be approximately 4.38%. On June 30, 2026, we amended our credit facilities agreement, combining our secured and unsecured credit facilities into a single $400.0 million credit facility (the "Credit Facility"). Under the amended agreement, the Credit Facility has separate secured and unsecured tranches. The amendment allows Chartwell, subject to availability of sufficient security, to maximize borrowing capacity of the credit facility at secured pricing. At the current BBB rating by DBRS, last confirmed by DBRS on May 7, 2026, amounts borrowed under the secured tranche bear interest at the banks' prime rate ("Prime") plus 30 bps or at the the Canadian Overnight Repo Rate Average ("CORRA") plus 130 bps plus credit spread adjustment, and amounts borrowed under the unsecured tranche bear interest at Prime plus 45 bps or CORRA plus 145 bps plus credit spread adjustment. The cost of our Credit Facility is based on our credit rating. The amendment also extended the maturity of the Credit Facility from May 29, 2029 to May 29, 2031. On November 6, 2025, we filed a new prospectus supplement to renew our at-the-market equity distribution program (the "2025 ATM Program") to allow us to issue up to $500.0 million of Trust Units from treasury to the public from time to time. During the six months ended June 30, 2026, we issued an aggregate 6,755,772 Trust Units under the 2025 ATM Program at an average price of $21.08 per Trust Unit for total gross proceeds of $142.4 million. Commission and other costs amounted to $2.1 million. The 2025 ATM Program was terminated on May 7, 2026, with approximately $382.4 million of cumulative Trust Units issued and sold under the program. On May 7, 2026, we filed a new final base shelf prospectus and a new prospectus supplement for the ATM Program (the "2026 ATM Program") to allow us to issue up to an additional $500.0 million of Trust Units. The 2026 ATM Program is expected to remain in place until June 7, 2029, unless terminated prior to such date by Chartwell or otherwise in accordance with the terms of the Equity Distribution Agreement which sets out the terms of the sale of Trust Units under the 2026 ATM Program. During the three months ended June 30, 2026, we issued an aggregate 3,343,539 Trust Units under the 2026 ATM Program at an average price of $21.74 per Trust Unit for total gross proceeds of $72.7 million. Commission and other costs amounted to $1.3 million. Quarterly Investor Materials and Conference Call We invite you to review our Q2 2026 investor materials on our website at investors.chartwell.com. Q2 2026 Financial Statements A conference call hosted by Chartwell's senior management will be held Friday, August 7, 2026, at 10:00 AM ET. Participation in the live conference call can be accessed by registering on the Investor Relations section of Chartwell's website or by clicking on the following link Participant Registration. A slide presentation to accompany management's comments during the conference call will be available on the website. To access the live webcast of the conference call and presentation, please go to the Investor Relations section of Chartwell's website or click on the following link Q2 2026 Results Webcast. A replay of the webcast will be available following the conference call on the Investor Relations section of Chartwell's website at investors.chartwell.com. Footnotes
About Chartwell Chartwell is in the business of serving and caring for Canada's seniors, committed to its vision of Making People's Lives BETTER and to providing a happier, healthier, and more fulfilling life experience for its residents. Chartwell is an unincorporated, open-ended real estate trust which indirectly owns and operates a complete range of seniors housing communities, from independent living through to assisted living and long term care. Chartwell is one of the largest operators in Canada, serving approximately 25,000 residents in four provinces across the country. For more information visit www.chartwell.com. Forward-Looking Information This press release contains forward-looking information that reflects the current expectations, estimates and projections of management about the future results, performance, achievements, prospects or opportunities for Chartwell and the seniors housing industry. Forward-looking statements are based upon a number of assumptions and are subject to a number of known and unknown risks and uncertainties, many of which are beyond our control, and that could cause actual results to differ materially from those that are disclosed in or implied by such forward-looking statements. Examples of forward-looking information in this document include, but are not limited to, statements regarding acquisitions and dispositions, including closing and financing details; development activities; debt financings; portfolio optimization strategies; joint ventures; expectations with respect to taxes that are expected to be payable in the current and future years; statements regarding occupancy and rate forecasts; and the 2026 ATM Program, including the expected benefits thereof and intended use of net proceeds. Forward-looking information can be generally identified by the use of words such as "anticipate," "continue," "estimate," "expect," "expected," "intend," "may," "will," "project," "plan," "should," "believe," and similar expressions. There can be no assurance that forward-looking information will prove to be accurate, as actual results and future events could differ materially from those expected or estimated in such statements. Accordingly, readers should not place undue reliance on forward-looking information. These assumptions, risks and uncertainties are more fully described in the "Risks and Uncertainties and Forward-Looking Information" section in Chartwell's Q2 2026 MD&A, and in materials filed with the securities regulatory authorities in Canada from time to time, including but not limited to our most recent Annual Information Form (the "AIF"). A copy of the Q2 2026 MD&A, the AIF, and Chartwell's other publicly filed documents can be accessed under Chartwell's profile on the SEDAR+ website at sedarplus.com. Except as required by law, Chartwell does not intend to update or revise any forward-looking statements, whether as a result of new information, future events, or for any other reason. For more information, please contact: Non-GAAP Financial Measures Chartwell's condensed consolidated interim financial statements are prepared in accordance with International Financial Reporting Standards ("IFRS"). Management uses certain financial measures to assess Chartwell's operating and financial performance, which are measures not defined in generally accepted accounting principles ("GAAP") under IFRS. The following measures: FFO, FFO per unit, same property adjusted NOI, adjusted NOI, adjusted operating margin, REVPOS, DOEPOS, NOIPOS, liquidity, interest coverage ratio and net debt to adjusted EBITDA ratio as well as other measures discussed elsewhere in this release, do not have a standardized definition prescribed by IFRS. They are presented because management believes these non-GAAP measures are relevant and meaningful measures of Chartwell's performance and as computed may differ from similar computations as reported by other issuers and may not be comparable to similarly titled measures reported by such issuers. For a full definition of these measures, please refer to the Q2 2026 MD&A available on Chartwell's website and on SEDAR+. The following table reconciles property revenue and direct property operating expense from our financial statements to adjusted property revenue and adjusted direct property operating expense, and NOI to Adjusted NOI, and identifies contributions from our same property portfolio, our growth portfolio, and our repositioning portfolio:
The following table provides a reconciliation of net income/(loss) to FFO:
The following table provides details of the weighted average number of occupied suites used in calculations of REVPOS, DOEPOS, and NOIPOS:
SOURCE Chartwell Retirement Residences (IR) | ||||||||||||||||||||||||||||||||||||||||||||||||||||||||||||||||||||||||||||||||||||||||||||||||||||||||||||||||||||||||||||||||||||||||||||||||||||||||||||||||||||||||||||||||||||||||||||||||||||||||||||||||||||||||||||||||||||||||||||||||||||||||||||||||||||||||||||||||||||||||||||||||||||||||||||||||||||||||||||||||||||||||||||||||||||||||||||||||||||||||||||||||||||||||||||||||||||||||||||||||||||||||||||||||||||||||||||||||||||||||||||||||||||||||||||||||||||||||||||||||||||||||||||||||||||||||||||||||||||||||||||||||||||||||||||||||||||||||||||||||||||||||||||||||||||||||||||||||||||||||||||||||||||||||||||||||||||||||||||||||||||||||||||||||||||||||||||||||||||||||||||||||||||||||||||||||||||||||||||||||||||||||||||||||||||||||||||||||||
Company Codes: Toronto:CSH.UN | ||||||||||||||||||||||||||||||||||||||||||||||||||||||||||||||||||||||||||||||||||||||||||||||||||||||||||||||||||||||||||||||||||||||||||||||||||||||||||||||||||||||||||||||||||||||||||||||||||||||||||||||||||||||||||||||||||||||||||||||||||||||||||||||||||||||||||||||||||||||||||||||||||||||||||||||||||||||||||||||||||||||||||||||||||||||||||||||||||||||||||||||||||||||||||||||||||||||||||||||||||||||||||||||||||||||||||||||||||||||||||||||||||||||||||||||||||||||||||||||||||||||||||||||||||||||||||||||||||||||||||||||||||||||||||||||||||||||||||||||||||||||||||||||||||||||||||||||||||||||||||||||||||||||||||||||||||||||||||||||||||||||||||||||||||||||||||||||||||||||||||||||||||||||||||||||||||||||||||||||||||||||||||||||||||||||||||||||||||